
Fig. 2-S2
- ID
- ZDB-FIG-180730-20
- Publication
- Vinayagam et al., 2018 - Electron cryo-microscopy structure of the canonical TRPC4 ion channel
- Other Figures
- All Figure Page
- Back to All Figure Page
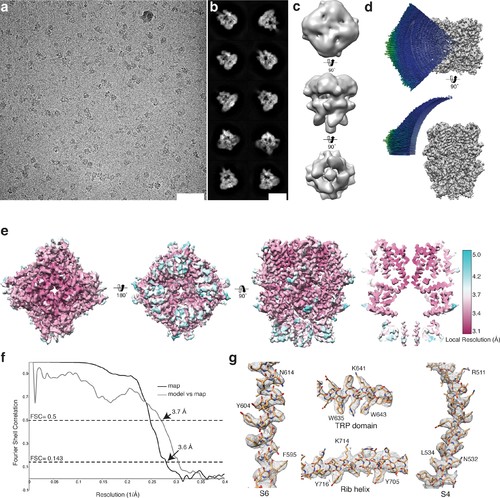
Cryo-EM structure of TRPC4DR. (a-b) Representative digital micrograph area (a) and selected 2-D class averages (b) of TRPC4DR embedded in vitrified ice. Scale bars, 50 nm (a), and 10 nm (b). (c) The ab initio 3-D reconstruction obtained with RVIPER. (d) Angular distribution of the particles. (e) The cryo-EM density map of TRPC4DR colored according to the local resolution. (f) Fourier Shell Correlation (FSC) curve between maps from two independently refined half data sets (black). The 0.143 criterion indicates an average resolution of 3.6 Å. The grey curve shows the FSC curve between the final map versus the atomic model. (g) Representative regions of the density with fitted atomic model. |