
Fig. 4
- ID
- ZDB-FIG-180720-34
- Publication
- Löhr et al., 2018 - Diet-Induced Growth Is Regulated via Acquired Leptin Resistance and Engages a Pomc-Somatostatin-Growth Hormone Circuit
- Other Figures
- All Figure Page
- Back to All Figure Page
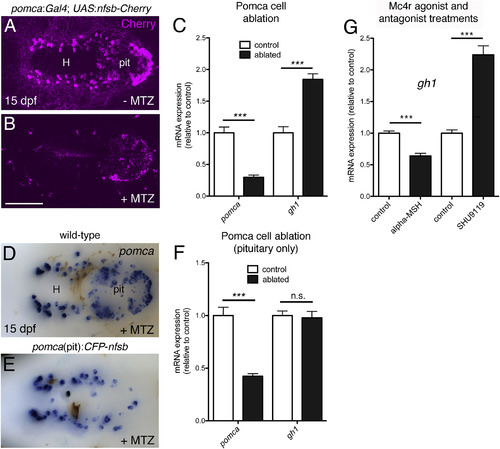
Pomca/αMSH Has a Negative Effect on gh1 Expression (A–C) Ablation of Pomca cells in hypothalamus and pituitary. Anti-RFP IF in pomca:KaITA4;UAS:nfsb-Cherry double transgenic larvae (15 dpf) without (A) or with MTZ treatment (B). (C) qRT-PCR analysis on pomca:KaITA4 single transgenic larvae (control) compared to pomca:KaITA4;UAS:nfsb-Cherry double transgenic larvae (ablated) after 48-hr MTZ treatment revealing reduction of pomca (pointing to an ablation efficacy of ∼75%) and elevation of gh1 transcript levels. (D–F) Pituitary specific ablation of Pomca cells. pomca ISH on MTZ-treated wild-type (D) and pomca(pit):CFP-nfsb transgenic (E) larvae at 15 dpf. (F) Selective loss of pomca in the pituitary results in decreased pomca levels but does not affect gh1 expression as assessed by qRT-PCR. Abbreviations: pit, pituitary; H, hypothalamus. (G) qRT-PCR analysis of gh1 levels after treatment of 14 dpf zebrafish larvae with αMSH or SHU9119. Ventral views are shown in (A), (B), (D), and (E). Scale bars represent 100 μm (A, B, D, and E); ∗∗∗p < 0.001; n.s., not significant. Error bars in (C), (F), and (G) show SD. |