
Fig. 4
- ID
- ZDB-FIG-180621-54
- Publication
- Marcoleta et al., 2018 - Evaluating Different Virulence Traits of Klebsiella pneumoniae Using Dictyostelium discoideum and Zebrafish Larvae as Host Models.
- Other Figures
- All Figure Page
- Back to All Figure Page
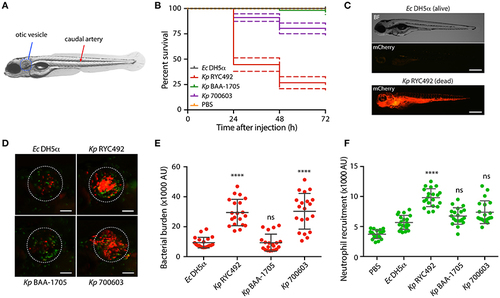
K. pneumoniae strains show different virulence behavior in the zebrafish larvae as revealed by survival curves and neutrophil recruitment. (A) Scheme of a 5-dpf zebrafish larva. Bacteria were injected in the dorsal caudal artery (red arrow) for establishing a rapid systemic infection, or in the otic vesicle (blue circle) for a localized infection. (B) Kaplan-Meier survival curves following injection of 3 dpf larvae with various strains of K. pneumoniae or with E. coli DH5α as a control. Larvae survival was monitored for 3 days after injection. The data are representative of three independent experiments, with a total of 57 larvae per bacterial strain. (C) Representative picture of a larva infected for 24 h with K. pneumoniae RYC492 strain, after acute bacteremia and death, and an unaffected larva injected with E. coli as a control. Bacteria expressing mCherry fluorescent protein is shown red. Scale bar, 500 μm. (D) Neutrophils attracted to the otic vesicle of Tg(BACmpo:gfp) zebrafish larvae injected with K. pneumoniae strains or E. coli DH5α after 24 h post-injection (hpi). Bacteria are red and neutrophils are green. The white dashed lines encircle the otic vesicle. Scale bar, 100 μm. (E) Bacterial burden in the otic vesicle of zebrafish larvae after 24 hpi. Measurements of red fluorescence from mCherry-labeled bacteria are plotted as arbitrary units (AU) for each K. pneumoniae strain or for E. coli DH5α. The data are representative of three replicates, with a total of 21 larvae per condition. (F) Neutrophils infiltrated in the otic vesicle of Tg(BACmpo:gfp) zebrafish larvae after 24 hpi. Measurements of green fluorescence from EGFP-labeled neutrophils are plotted as arbitrary units (AU) for larvae injected with K. pneumoniae strains, E. coli DH5α, or PBS. The data are representative of three independent experiments, with a total of 21 larvae per bacterial strain. Error bars represent the standard deviation among the replicates. Statistical differences compared to E. coli DH5α were assessed using a Kruskal-Wallis analysis followed by Dunn's multiple comparisons test. ****p < 0.0001. |