
Fig. 6
- ID
- ZDB-FIG-180608-32
- Publication
- van Leeuwen et al., 2018 - A transgenic zebrafish model for the in vivo study of the blood and choroid plexus brain barriers using claudin 5.
- Other Figures
- All Figure Page
- Back to All Figure Page
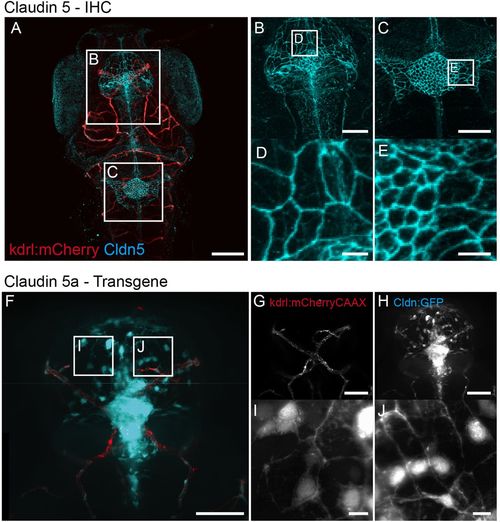
CP morphology. (A) Dorsal view of the head of a 7 dpf Tg(kdrl:mCherry)is5 larva showing blood vessels (red) and immunohistochemistry (IHC) labelling of Claudin 5 (cyan). Boxed areas are shown enlarged in B,D and C,E, and show detailed analysis of the collection of cells that forms the dCP (B) and mCP (C) and is closely connected by Claudin 5. The sheet of cells found in the dCP and mCP of a 7 dpf TgBAC(cldn5a:EGFP)vum2 larva is similar to the phenotype in A-E, although subcellular localizations are not the same. (F) Z-stack of mCP of a Tg(kdrl:mCherry)is5;TgBAC(cldn5a:EGFP)vum2 larva with red fluorescent blood vessels (G) and cyan fluorescent claudin 5a (H). Boxed areas are shown enlarged in I and J, showing high magnification of the network formed by claudin 5a-expressing cells forming the mCP. Scale bars: 100 μm in A; 50 μm in B,C; 10 μm in D,E; 50 μm in F-H; 10 μm in I,J. |
| Genes: | |
|---|---|
| Antibody: | |
| Fish: | |
| Anatomical Terms: | |
| Stage: | Days 7-13 |