
Fig. S2
- ID
- ZDB-FIG-180501-9
- Publication
- Gross-Thebing et al., 2017 - The Vertebrate Protein Dead End Maintains Primordial Germ Cell Fate by Inhibiting Somatic Differentiation
- Other Figures
- All Figure Page
- Back to All Figure Page
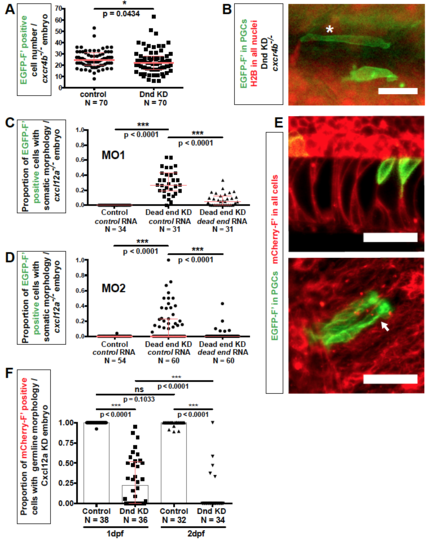
Related to Figure 2. Morphology of Dnd-depleted PGCs (A) The number of EGFP-positive cells in 24 hpf cxcr4b-/- embryos injected with either dnd or control Morpholino. p-values were determined based on Mann-Whitney-U test with α=0.05. Data are presented as median ± IQR. (B) Examples of morphological phenotypes of PGCs knocked down for Dnd (green) as observed in 24 hpf cxcr4b-/- embryos. An asterisk points at a cell defined as showing muscle cell morphology, while a neighboring cell (lower position) does not present a clear morphology of a PGC, nor of a defined somatic cell type. Scale bar, 30 μm. (C) The dnd Morpholino (MO1) specifically targets dnd RNA in zebrafish embryos. The proportion of PGCs with distinct somatic-cell morphologies in Dnd-knocked down embryos is reduced by injection of dnd RNA that is not targeted by the dnd Morpholino (MO1). The experiment was conducted in cxcl12a-/- embryos and results evaluated at 24 hpf. p-values were determined based on Mann-Whitney-U test with α=0.05 and corrected for multiple comparison. Data are presented as median ± IQR. (D) A dnd Morpholino with different binding sequence (MO2) induces a phenotype similar to that induced by MO1. The induced phenotype of MO2 can be reversed by injection of dnd RNA that is not targeted by this Morpholino. The experiment was conducted in cxcl12a-/- embryos and results evaluated at 24 hpf. p-values were determined based on Mann-Whitney-U test with α=0.05 and corrected for multiple comparison. Data are presented as median ± IQR. (E) Dnd-deficient PGCs (green) exhibit morphologies similar to those of notochord (left) and neuronal cells (right). The arrow points at dendrite-like protrusions as observed employing maximum intensity projection. Somatic cells (red) were labeled with mCherry-F’. Confocal images captured at 24 hpf. Scale bars, 50 μm. (F) Proportion of PGCs showing germline morphology in Dnd-depleted, Cxcl12a knockdown embryos at 1 and 2 days post fertilization (dpf). Number of embryos (N). p-values were determined using the Mann-Whitney-U test with α=0.05 and corrected for multiple comparison. Data are presented as median ± IQR. Number of embryos (N), Farnesylated (F’), Knockdown (KD), hours post fertilization (hpf), days post fertilization (dpf), Morpholino (MO). |
Reprinted from Developmental Cell, 43, Gross-Thebing, T., Yigit, S., Pfeiffer, J., Reichman-Fried, M., Bandemer, J., Ruckert, C., Rathmer, C., Goudarzi, M., Stehling, M., Tarbashevich, K., Seggewiss, J., Raz, E., The Vertebrate Protein Dead End Maintains Primordial Germ Cell Fate by Inhibiting Somatic Differentiation, 704-715.e5, Copyright (2017) with permission from Elsevier. Full text @ Dev. Cell