
Fig. 1
- ID
- ZDB-FIG-180425-3
- Publication
- Moreno-Mateos et al., 2017 - CRISPR-Cpf1 mediates efficient homology-directed repair and temperature-controlled genome editing
- Other Figures
- All Figure Page
- Back to All Figure Page
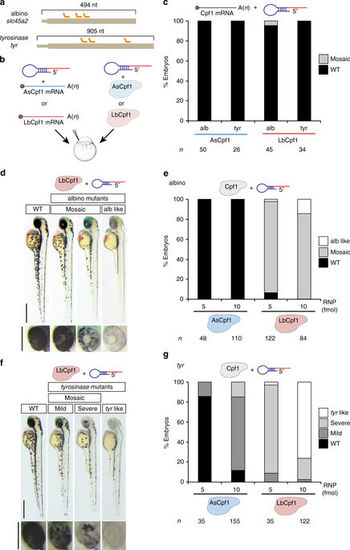
LbCpf1–crRNA RNP complexes are a robust genome editing system in zebrafish. a Diagram illustrating three crRNAs (orange) targeting slc45a2 and tyr exon 1 in zebrafish. b Schematic illustrating the experimental set-up to analyze CRISPR-Cpf1-mediated mutations in zebrafish. Three crRNAs (a) were either mixed with mRNA coding for AsCpf1 or LbCpf1 or assembled into RNP complexes with their corresponding purified proteins and injected in one-cell-stage embryos. c Phenotypic evaluation of crRNAs (30 pg/crRNA) and mRNA (100 pg) injections. Stacked barplots showing the percentage of mosaic (gray) and phenotypically wild-type (WT; black) embryos 48 h post fertilization (hpf) after injection. d Phenotypes obtained after the injection of the LbCpf1–crRNA RNP complexes targeting slc45a2 showing different levels of mosaicism compared to the WT. Lateral views (scale bar, 0.5 mm) and insets of the eyes (scale bar, 0.25 mm) of 48 hpf embryos are shown. e Phenotypic evaluation of Cpf1–crRNA RNP complexes injections targeting slc45a2 (albino). Stacked barplots showing the percentage of alb-like (white), mosaic (gray), and phenotypically WT (black) embryos 48 hpf after injection using different amounts (fmol) of RNP complexes. Number of embryos evaluated (n) is shown for each condition. f Phenotypes obtained after the injection of the LbCpf1–crRNA RNP complexes targeting tyr showing different levels of mosaicism compared to the WT. Lateral views (scale bar, 0.5 mm) and insets of the eyes (scale bar, 0.25 mm) of 48 hpf embryos are shown. g Phenotypic evaluation of Cpf1–crRNA RNP complexes targeting tyrosinase (tyr). Stacked barplots showing the percentage of tyr-like (white), severe mutant (light gray), mild mutant (dark gray), and phenotypically WT (black) embryos 48 hpf after injection using different amounts (fmol) of RNP complexes. Number of embryos evaluated (n) is shown for each condition |