
Fig. S8
- ID
- ZDB-FIG-180410-35
- Publication
- Sawamiphak et al., 2017 - Transient cardiomyocyte fusion regulates cardiac development in zebrafish
- Other Figures
- All Figure Page
- Back to All Figure Page
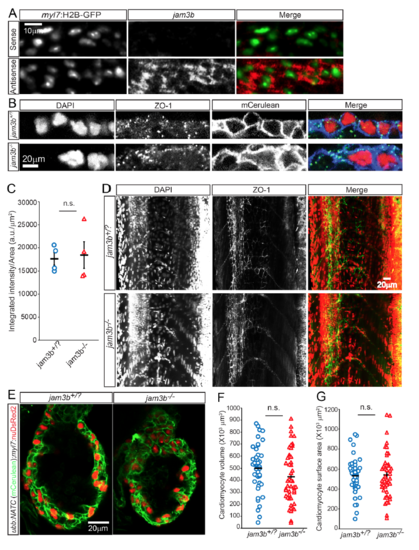
Unaltered cardiomyocyte adhesion and morphology in jam3b mutants. A, In situ hybridization detected the expression of jam3b (red) in cardiomyocytes, labeled by myl7:H2B-GFP expression (green nuclei). B, Expression levels of the tight junctionassociated protein ZO-1 at the plasma membrane of jam3b-/- hearts were comparable to those of control animals (jam3b+/? = jam3b+/+ or jam3b+/-). 3 dpf animals from jam3b+/-;Tg(ubb:NATC) X jam3b+/- crosses were processed for whole mount immunostaining for ZO-1 (green) and GFP (detecting membrane Cerulean, blue). DAPI labeled nuclei are shown in red. C, Quantification of ZO-1 expression levels based on integrated intensity of the ZO-1 signals per plasma membrane area of individual cardiac ventricle. D, Jam3b deficiency does not appear to affect tight junction formation in epithelial or endothelial tissues. Expression and localization of ZO-1 (green), detected at 3 dpf by immunofluorescence, in jam3b-/- larvae appear identical to those in control jam3+/? siblings. DAPI staining (red) shows that skeletal myocytes are mononucleated in jam3b-/- fish, while they are mutinucleated in jam3b+/? siblings. E-G, Jam3b deficient animals show unaltered cardiomyocyte morphology. E, 5 dpf larvae from jam3+/-;Tg(ubb:NATC) X jam3+/-;Tg(myl7:nuDsRed2) crosses were immunostained to detect membrane Cerulean (green) and nuclear DsRed2 (red) expression. F, G, Graphs showing that cardiomyocyte volume (F) and surface area (G) were not altered in jam3b-/- larvae. Bars and error bars in C, F, and G represent means±SEM. n.s. not significant. Images are maximum or average intensity projections of 4 (A, B, and E), and 20 (D) μm thick confocal stacks shown in lateral views. 6-12 (A), 4 (B and C), 6-8 (D) larvae and 44 (F) or 49 (G) cardiomyocytes were examined. |