
FIGURE
Fig. 1
- ID
- ZDB-FIG-171228-16
- Publication
- Presslauer et al., 2017 - Dynamics of miRNA transcriptome during gonadal development of zebrafish
- Other Figures
- All Figure Page
- Back to All Figure Page
Fig. 1
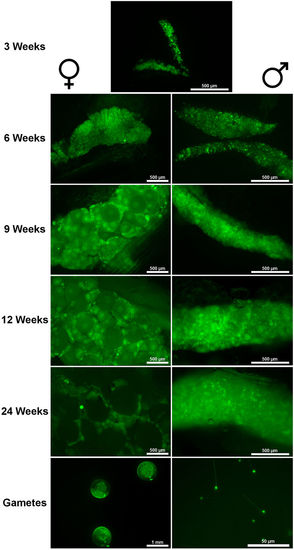
Representation of zebrafish gonads expressing vasa:vasa-eGFP transgene at each sequenced gonadal stage. |
Expression Data
| Gene: | |
|---|---|
| Fish: | |
| Anatomical Terms: | |
| Stage Range: | Days 21-29 to Adult |
Expression Detail
Antibody Labeling
Phenotype Data
Phenotype Detail
Acknowledgments
This image is the copyrighted work of the attributed author or publisher, and
ZFIN has permission only to display this image to its users.
Additional permissions should be obtained from the applicable author or publisher of the image.
Full text @ Sci. Rep.