
Fig. 4
- ID
- ZDB-FIG-171127-59
- Publication
- Takita et al., 2016 - Effects of NDRG1 family proteins on photoreceptor outer segment morphology in zebrafish
- Other Figures
- All Figure Page
- Back to All Figure Page
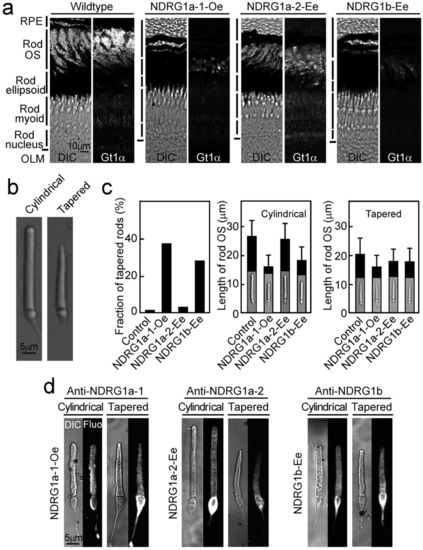
Effects of overexpression of NDRG1a-1, ectopic expression of NDRG1a-2 or NDRG1b in adult zebrafish rods. (a) NDRG1a-1 was overexpressed (NDRG1a-1-Oe), NDRG1a-2 was ectopically expressed (NDRG1a-2-Ee) or NDRG1b was ectopically expressed (NDRG1b-Ee) in zebrafish rods. Each adult retina including that of wildtype (Wildtype) was sectioned and viewed with differential interference contrast (DIC) or immunoprobed with anti-rod transducin α-subunit antibody (Gt1α). Magnifications are the same throughout the images in (a) (scale bar, 10 μm). Vertical bars from top to bottom in the left of each pair of images show a part of a layer of the retinal pigment epithelium (RPE), outer segment, ellipsoid, myoid and nucleus layers, respectively, and horizontal bars show the outer limiting membrane (OLM). The rod outer segment layer can be identified with anti-Gt1α-positive signals (right image in each pair). (b) A rod with normal cylindrical OS (left) and that with tapered OS (right). Magnifications are the same in (b) (scale bar, 5 μm). (c) Rods in mCherry-expressing control (Control), NDRG1a-1-Oe, NDRG1a-2-Ee or NDRG1b-Ee were isolated, and the fraction of tapered rods was determined (left). The number of rods with tapered OS were 2.0% in Control (217 rods with tapered OS and 10429 rods with cylindrical OS in 5 fish), 38% in NDRG1a-1-Oe (539 tapered and 892 cylindrical in 5 fish), 3.8% in NDRG1a-2-Ee (278 tapered and 7011 cylindrical in 4 fish) and 28% in rods in NDRG1b-Ee (1258 tapered and 3155 cylindrical in 4 fish). The length of the rods showing a cylindrical shape (middle) and the length of the rods showing tapered shape (right) were measured in the population indicated above. Each result shows mean ± SD (middle and right). (d) Expression of NDRG1a-1 (left 4 panels), NDRG1a-2 (middle 4 panels) and NDRG1b (right 4 panels) were immunodetected with corresponding specific antiserum in isolated rods showing cylindrical OS (left 2 panels in each set of panels) and those showing tapered OS (right 2 panels in each set) in each transgenic fish. Each rod was viewed with DIC (DIC) or immunofluorescently (Fluo). Magnifications are the same in (d) (scale bar, 5 μm). |
| Fish: | |
|---|---|
| Observed In: | |
| Stage: | Adult |