
Fig. 4
- ID
- ZDB-FIG-171020-18
- Publication
- Matsuda et al., 2017 - Granule cells control recovery from classical conditioned fear responses in the zebrafish cerebellum
- Other Figures
- All Figure Page
- Back to All Figure Page
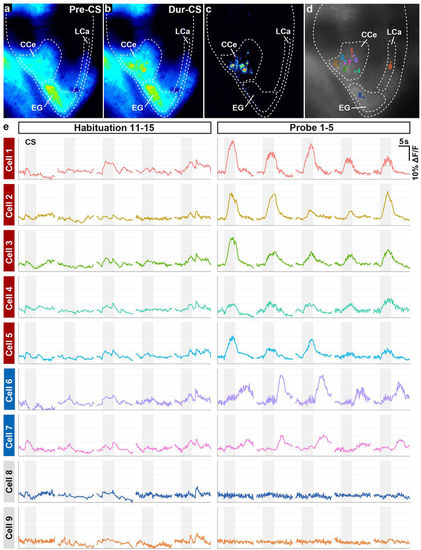
Cerebellar neurons were activated during classical fear conditioning. (a,b) Ca2+ imaging. GCaMP7a fluorescence intensity in Tg(elavl3:GAL4-VP16); Tg(UAS:GCaMP7a) larva before (pre-CS, a) and during (dur-CS, b) the CS in the probe sessions. The images were taken 2 s before and 2.5 s after the start of the CS presentation. Average images from nine trials in the probe session are shown. (c) The “dur-CS minus pre-CS” image generated by subtraction. Note that the CS evoked upregulated fluorescence intensity only in the CCe. (d,e) Time course of cerebellar neuronal activity. The fluorescence intensity from nine cerebellar neurons in a single larva was monitored during the habituation (11th–15th trials) and probe (1st–5th trials) sessions. Graph shows the ΔF/F, which was calculated by dividing the change in fluorescence intensity at the indicated time point by the average intensity at 2 s before the CS (e). Gray boxes indicate the timing of the CS presentation. The position of the neurons is shown in (d). During the probe session, the CS evoked upregulated fluorescence in seven neurons (Cells 1–7) in the CCe. There was no change in fluorescence between the habituation and probe sessions in a neuron in the EG (Cell 8) or in one in the LCa (Cell 9). (See Fig. 1 for abbreviations). |