
FIGURE
Fig. S1
- ID
- ZDB-FIG-170905-4
- Publication
- Chen et al., 2017 - Bioconcentration and Metabolism of Emodin in Zebrafish Eleutheroembryos
- Other Figures
- All Figure Page
- Back to All Figure Page
Fig. S1
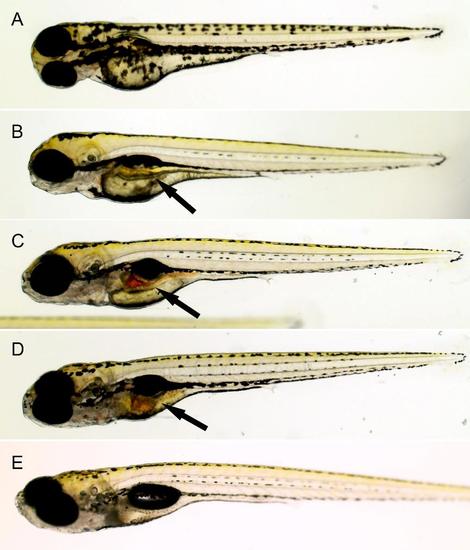
The micrograph of zebrafish larvae in the standard test at 0 h (A), 24 h (B), 72 h (C), 96 h (D) and 120 h (E). Arrows: accumulation of emodin and its metabolites in intestine. |
Expression Data
Expression Detail
Antibody Labeling
Phenotype Data
Phenotype Detail
Acknowledgments
This image is the copyrighted work of the attributed author or publisher, and
ZFIN has permission only to display this image to its users.
Additional permissions should be obtained from the applicable author or publisher of the image.
Full text @ Front Pharmacol