
Fig. 4
- ID
- ZDB-FIG-170809-18
- Publication
- Di Gioia et al., 2017 - A defect in myoblast fusion underlies Carey-Fineman-Ziter syndrome
- Other Figures
- All Figure Page
- Back to All Figure Page
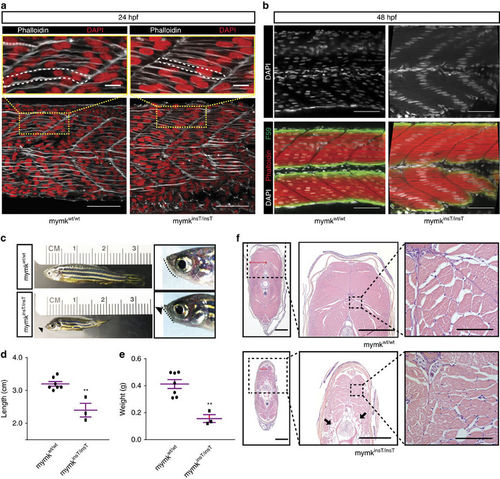
mymkinsT/insT zebrafish embryos lack fast-twitch myoblast fusion and adults have CFZS-like myopathic features. (a) 24 h.p.f. embryos stained with 488-conjugated phalloidin (white) and DAPI (red) to label the forming myofibers and nuclei, respectively. WT mymkwt/wt embryo myofibers are multinucleated, while mymkinsT/insT embryo myofibers elongate and differentiate, but fail to fuse. (b) Upper panel: 48 h.p.f. embryos stained with DAPI show the distribution of myonuclei in fused mymkwt/wt (left) and unfused (right) mymkinsT/insT fast-twitch myofibers. Compared to the random appearance of WT myonuclei, the single nuclei in unfused mymkinsT/insT myofibers pathologically align at the center, equidistant between two myosepta. Lower panel: Merged images showing phalloidin (red), DAPI (white) and F59 (green, anti-myosin heavy chain) confirm that affected myofibers are fast-twitch fibers because they do not express F59, a slow-twitch cellular marker in zebrafish. (c) A 6-month-old male mymkwt/wt zebrafish (top) compared to an age- and sex-matched tmem8cinsT/insT fish (bottom). Male and female mutant zebrafish are small and have a flattened/retrognathic jaw (right, indicated by dotted line and black arrowhead) not appreciated during larval and early juvenile stages. By 3 months of age, jaw weakness prohibits mymkinsT/insT zebrafish from fully closing their mouths. (d,e) Adult mymkinsT/insT zebrafish (n=3) are significantly shorter (d) and weigh less (e) than age and sex-matched WT siblings (n=7). (f) Hematoxylin-Eosin (H&E) staining of caudal transverse sections of WT (top) and mymkisnT/insT (bottom) of 6-month-old male zebrafish siblings at three magnifications. Zebrafish mymk-expressing fast-twitch myofibers are located centrally, while mymk-negative slow-twitch myofibers are located near the body wall and stain slightly darker with H&E. The mutant fish have reduced body width (compare the red line extending from the dorsal artery to the body wall in WT versus mutant fish in left photos), and fat infiltration (thick black arrows, middle photo) that is absent in the WT fish. Fast-twitch myofibers appear smaller compared to WT (right). Statistics by two-tailed Student’s unpaired t-test; mean±s.e.m.; **P<0.002. Scale bars, (a,b) main images 50 μm, insets 10 μm. (f) left and center panels 500 μm, right panels 50 μm. See also Supplementary Figs 6,7 and Supplementary Video. |
| Fish: | |
|---|---|
| Observed In: | |
| Stage Range: | Prim-5 to Adult |