
Fig. 3
- ID
- ZDB-FIG-170614-6
- Publication
- Krens et al., 2017 - Interstitial fluid osmolarity modulates the action of differential tissue surface tension in progenitor cell segregation during gastrulation
- Other Figures
- All Figure Page
- Back to All Figure Page
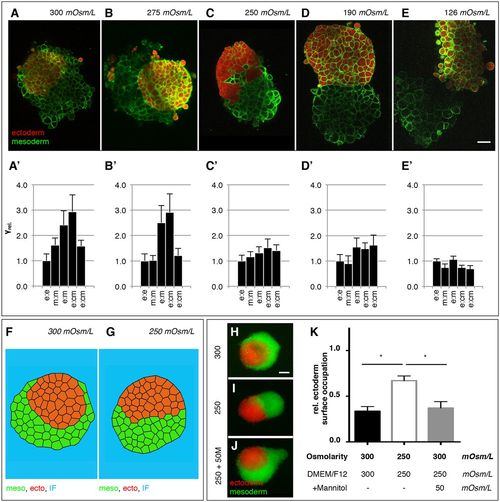
Modulation of progenitor cell interfacial tensions by medium osmolarity. (A-E) Representative single plane confocal images of tissue aggregates consisting of ectoderm or mesoderm progenitor cells expressing Lyn-Venus at the plasma membrane (green) of all cells and cultured for 5 h in the presence of medium with 300 (A), 275 (B), 250 (C), 190 (D) or 126 (E) mOsm/L osmolarity. Ectoderm aggregates were additionally labeled with cytoplasmic dextran-Alexa648 (red) (see also Movie 3). Scale bar: 50 μm. (A′-E′) Relative interfacial tensions (γrel.) obtained by 3D-CellFIT for enveloping tissues cultured for 5 h in the presence of medium with 300 (A′), 275 (B′), 250 (C′), 190 (D), 126 (D′) or 250 (E′) mOsm/L osmolarity with e (ectoderm), m (mesoderm) and cm (culture medium). Error bars indicate standard deviations. (F,G) Stable configurations of finite element simulations of tissue envelopment (10,000 simulation iterations) in heterotypic tissue aggregates consisting of ectoderm (red) or mesoderm (green) cells surrounded by culture medium (blue), using 3D-CellFIT-obtained tension distributions shown in A (300 mOsm/L) with γe-e=1.00, γm-m=1.62, γe-m=2.41, γe-cm=2.94, γm-cm=1.58; and in C (250 mOsm/L) with γe-e=1.00, γm-m=1.16, γe-m=1.32, γe-cm=1.52, γm-cm=1.41. (H-J) Tissue envelopment of ectoderm (red) and mesoderm (green) progenitor cell aggregates cultured for 5 h in the presence of ∼300 mOsm/L culture medium (n=20 engulfment assays; H), ∼250 mOsm/L osmolarity culture medium (n=24 engulfment assays; I) or culture medium containing mannitol to restore osmolarity from 250 mOsm/L to 300 mOsm/L (250+50 M; n=21 engulfment assays, J). (K) Degree of envelopment was quantified by calculating the relative ectoderm surface occupation taking the heterotypical cell aggregate size into account. Error bars are standard deviations; *P<0.05. |