
Fig. 6
- ID
- ZDB-FIG-170505-38
- Publication
- Armstrong et al., 2017 - Shh promotes direct interactions between epidermal cells and osteoblast progenitors to shape regenerated zebrafish bone
- Other Figures
- All Figure Page
- Back to All Figure Page
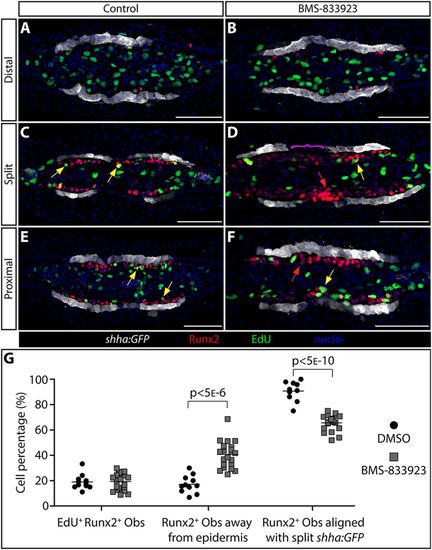
Shha-driven Smoothened signaling directs progenitor osteoblasts to migrate in step with transiently split basal epidermal clusters at the onset of ray branching. (A-F) Runx2 and EGFP immunostaining (red and white, respectively) and EdU incorporation (2 h treatment, green) on transverse 96 hpa fin sections from individual shha:GFP fish treated at 48 and 72 hpa with DMSO (A,C,E) or BMS-833923 (B,D,F). Nuclei are blue. (A,B) Far distal sections beyond the distal-most pObs. (C,D) Sections from positions where shha-expressing epidermal cells have split into two clusters on each side of the fin. (E,F) Further proximal sections where shha is first induced by distal migrating epidermal cells. Yellow arrows indicate Runx2+/EdU+ cells located more than one cell layer from shha:GFP-expressing basal epidermis. Red arrows indicate Runx2+ pObs two or more cell layers distant from shha:GFP-positive epidermal cells. The magenta bracket in D highlights Runx2+ pObs that span the junction between split shha:GFP domains in BMS-833923-treated fish. (G) Quantification of pOb proliferation and the relative position of pObs to epidermal cells in regenerating fins from the above and similar DMSO versus BMS-833923 treated shha:GFP fish. Only images at ‘split’ positions are scored. Left plots: the fraction of EdU incorporating Runx2+ pObs. Middle plots: the fraction of pObs not directly adjacent to GFP+ epidermal cells. Right plots: the fraction of pObs aligned with split clusters of shha:GFP-expressing epidermis. Each data point represents a scored independent section (11 individual rays from five DMSO-treated fish and 23 rays from seven BMS-833923-treated fish). Two-tailed Student's t-tests were used to determine statistically significant differences (P<0.05) between the means of control versus small-molecule-treated samples. Scale bars: 50 μm. |