
FIGURE
Fig. S4
- ID
- ZDB-FIG-170425-41
- Publication
- Bayés et al., 2017 - Evolution of complexity in the zebrafish synapse proteome
- Other Figures
- All Figure Page
- Back to All Figure Page
Fig. S4
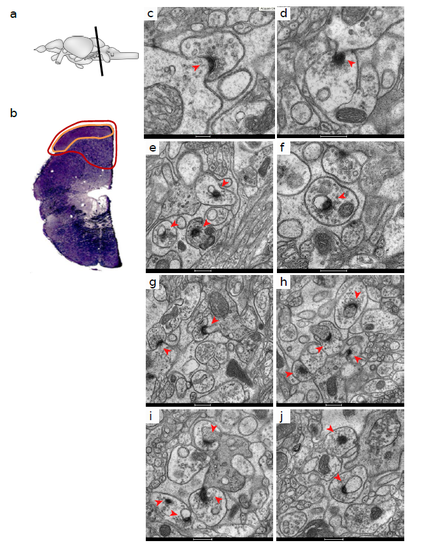
Ultrastructure of synapses from Zebrafish cerebellum. (a) Schematic representation of the zebrafish brain. The black line indicates the position of the hindbrain. (b) Coronal semi-thin section of the zebrafish hindbrain stained with toluidine blue. The red encircled area corresponds to the cerebellar corpus. The orange line indicates the area where asymmetric synapses were identified. (c-j) PSDs found in different sections of the cerebellum. Arrowheads indicate PSDs showing the curved morphology with the presynaptic element surrounding the postsynaptic spine. Scale bar c 200 nm; scale bars d-j 500 nm. |
Expression Data
Expression Detail
Antibody Labeling
Phenotype Data
Phenotype Detail
Acknowledgments
This image is the copyrighted work of the attributed author or publisher, and
ZFIN has permission only to display this image to its users.
Additional permissions should be obtained from the applicable author or publisher of the image.
Full text @ Nat. Commun.