
Fig. 6
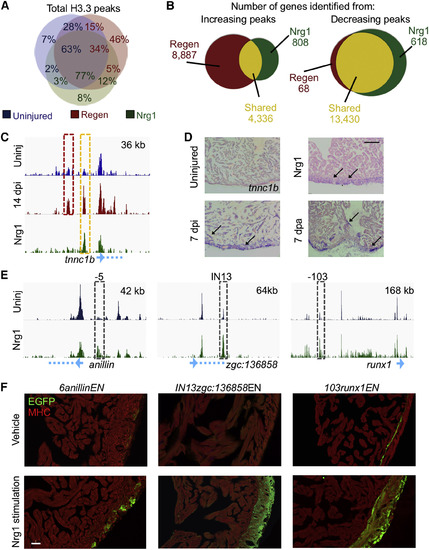
Shared Histone Dynamism Signatures between Injury- and Nrg1-Induced CM Proliferation (A) The Nrg1 H3.3 profile (green) overlaps more with the regeneration profile (red) than the uninjured profile (blue). The percentages represent the fraction of the total for each group and are labeled with color codes. For example, 12% of Nrg1 peaks overlap with 5% of regeneration peaks, neither of which overlap with the uninjured. However, the Nrg1 H3.3 profile only overlaps with 10% of the total peaks emerging during regeneration (5%/5% + 46%). (B) Left: H3.3 peaks near 4,336 genes that increase during regeneration with respect to uninjured CMs also increase during Nrg1-stimulated hyperplasia (yellow). See Table S2. Many peaks increase H3.3 occupancy only during regeneration (red) or Nrg1 stimulation (green). Right: genes identified near H3.3 peaks that decrease from the uninjured profile highly overlap between regenerating and Nrg1-stimulated CM samples (13,340 total or 99% of regeneration [Regen] and 96% of Nrg1 peaks). See Table S5. (C) The tnnc1b gene is located just downstream of a regeneration-specific H3.3 enrichment site (red box) and a site enriched with H3.3 during regeneration and Nrg1 stimulation (yellow box). (D) ISH shows visual increases of the tnnc1b transcript (violet signals, arrows) in ventricles regenerating from ablation (7 dpi) and resection (7 dpa), and in ventricles overexpressing Nrg1. Scale bar, 125 μm. (E) Genome browser tracks indicating H3.3 occupancy responses during Nrg1 stimulation of three sequences used to generate CREE reporter lines (dashed boxes). The two tracks show enrichment of H3.3 in uninjured (blue) and Nrg1-stimulated (green) ventricles. Genes are cartooned at the bottom in light blue. Top right: x axis. (F) CREE reporters 5anillinENfos:EGFP (left), IN13zgc:136858ENfos:EGFP (middle), and 103runx1ENfos:EGFP (right) induce EGFP in CMs in the ventricular wall during transgenic Nrg1 stimulation. An antibody against myosin heavy chain (MHC, red) was used to stain cardiac muscle. Scale bar, 50 μm. See also Figure S6. |
| Genes: | |
|---|---|
| Fish: | |
| Conditions: | |
| Anatomical Term: | |
| Stage: | Adult |
| Fish: | |
|---|---|
| Condition: | |
| Observed In: | |
| Stage: | Adult |
Reprinted from Developmental Cell, 40, Goldman, J.A., Kuzu, G., Lee, N., Karasik, J., Gemberling, M., Foglia, M.J., Karra, R., Dickson, A.L., Sun, F., Tolstorukov, M.Y., Poss, K.D., Resolving Heart Regeneration by Replacement Histone Profiling, 392-404.e5, Copyright (2017) with permission from Elsevier. Full text @ Dev. Cell