
Fig. 3 S1
- ID
- ZDB-FIG-170223-31
- Publication
- Dyballa et al., 2017 - Distribution of neurosensory progenitor pools during inner ear morphogenesis unveiled by cell lineage reconstruction
- Other Figures
- All Figure Page
- Back to All Figure Page
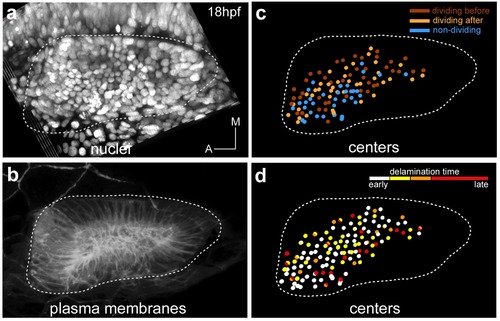
Spatial distribution of epithelial neuroblasts according to division behavior or delamination time. Tg[cldnb:lynGFP] Tg[Isl3:GFP] embryo was injected with H2B-mCherry at 1cell-stage, imaged and analyzed from 18 hpf to 36.2 hpf (Table 1). Images of (a) nuclei as Maximal Intensity Projection of few orthoplanes of the ventral otic vesicle, and (b) plasma membranes as 3D-rendering are displayed. (c) Spatial distribution of neuroblasts, whose reconstructed cell centers were color-coded according to their division behavior -before or after delamination- (Figure 3). Out of 116 tracked epithelial neuroblasts, 42 divide before delamination (red), 40 do so after delamination (orange), and 34 do not divide within this time window (blue). Note that there is no preferential spatial distribution of cells for these features. (d) Reconstructed cell centers of neuroblasts (n = 131) were color-coded according to time of delamination: 18–20 hpf white, 20–22 hpf yellow, 22–24 hpf orange, 24–30 hpf red. Neuroblasts giving rise to two sister cells falling into distinct delamination intervals are shown as bicolored cell centers (n = 11). ID Dataset: 140426aX. |