
Fig. 3
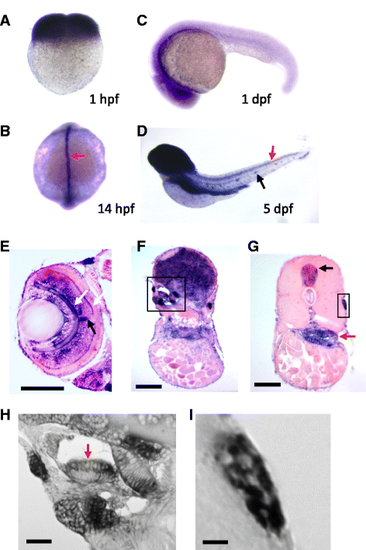
mgat5a expression during zebrafish embryo development. a–d Whole mount in situ hybridization analysis of mgat5a expression at 1 hpf (a), 14 hpf (b), 1 dpf (c), and 5 dpf (d). Orientations: lateral view in a, c, and d; dorsal view in b. Red arrow in b points to the expression in the dorsal midline. Red and black arrows in d point to the expression in spinal cord and lateral line neuromast. e–i Histology sectioning analysis of mgat5a expression in the retina (e), brain (f), and trunk (g). White arrows in e point to the expression in outer and inner plexiform layers of the retina. Black arrow in e points to the expression in the optic nerve. Black box in f demarcates the inner ear area. Black and red arrows in g point to the expression in the spinal cord and gut, respectively. Black box in g demarcates lateral line neuromast. h A magnified image of the inner ear region demarcated in f. Red arrow points to the enriched expression in the apical region of cristae. i A magnified image of the neuromast demarcated in g. Mosaic patterning indicates expression in some neuromast cells. Scale bars 100 μm in e, f, and g; 20 μm in h and i |
| Gene: | |
|---|---|
| Fish: | |
| Anatomical Terms: | |
| Stage Range: | 4-cell to Day 5 |