
Fig. S4
- ID
- ZDB-FIG-161122-45
- Publication
- Mouti et al., 2016 - Minimal contribution of ERK1/2-MAPK signalling towards the maintenance of oncogenic GNAQQ209P-driven uveal melanomas in zebrafish
- Other Figures
- All Figure Page
- Back to All Figure Page
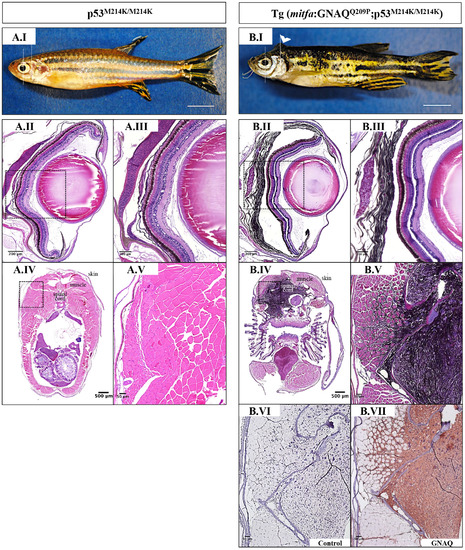
Oncogenic GNAQQ209P expression induces malignant CNS melanoma in p53-deficient zebrafish. A.I, B.I. Lateral views of 5-month-old zebrafish. (A.I) p53-deficient zebrafish (p53M214K/M214K). (B.I) Tg (mitfa:GNAQQ209P;p53M214K/ M214K) zebrafish developing masses protruding from the back of the head (white arrowhead). Scale bars, 0.5 cm. Representative images of H&E stained tissue sections through the torso of p53M214K/M214K animals A.IV, A.V. and age-matched Tg (mitfa:GNAQQ209P; p53M214K/M214K) B.IV, B.V. show highly infiltrative, pigmented malignancy appearing to emanate from the leptomeninges surrounding the hind brain of the latter. The same animals were sectioned through the eyes revealing normal development of the choroid in p53M214K/M214K mutants A.II, A.III., but benign hyperproliferation of choroidal melanocytes in Tg (mitfa:GNAQQ209P;p53M214K/M214K) B.II, B.III.. (A.III, A.V, B.III, B.V) Magnifications of the regions depicted in black dashed boxes in A.II, A.IV, B.II, B.IV, respectively. B.VI. Negative control section incubated with 1x PBS instead of primary antibody. B.VII. Area of pigmented melanocytic infiltration showing GNAQ expression upon IHC staining. Scale bar lengths, as indicated. |