Fig. 4
- ID
- ZDB-FIG-161117-3
- Publication
- Brunt et al., 2016 - Differential effects of altered patterns of movement and strain on joint cell behaviour and skeletal morphogenesis
- Other Figures
- All Figure Page
- Back to All Figure Page
|
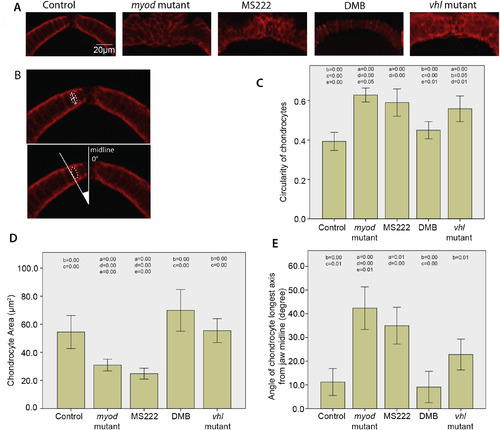
Flaccid paralysis affects the maturation of chondrocytes at the anterior tip of the MC. A) Confocal images of the anterior MC. 5dpf control, myod mutant, 3-5dpf MS222 anaesthetised treated and vhl mutant zebrafish cartilage was labelled with Collagen II antibody and DMB treated zebrafish cartilage was visualised using the Tg(Col2a1aBAC:mcherry) transgenic line. B) Dotted white lines show example cell. Solid white lines mark an example major and minor axis of a collagen II labelled chondrocyte used to calcuate the circularity of the cell (top panel), white lines display angle of cell relative to the midline (bottom panel). C) Graph showing comparison of cell circularity of chondrocytes at the tip of the MC in 5dpf control (n = 30), myod mutant (n = 33), 3-5dpf MS222 anaesthetic treated (n = 26), DMB treated (n = 28) and vhl mutant zebrafish (n = 33) (N.B 1.00 represents a perfect circle). D) Chondrocyte area measurements from cells at the tip of the MC in 5dpf control (n = 29), myod mutant (n = 28), 3-5dpf MS222 anaesthetic treated (n = 34), DMB treated (n = 22) and vhl mutant zebrafish (n = 31). E) Comparison of angle of the major axis of cell relative to the midline in 5dpf control (n = 9), myod mutant (n = 41), 3-5dpf MS222 anaesthetic treated (n = 47), DMB treated (n = 10) and vhl mutant zebrafish (n = 34). For all graphs at least 3 fish were measured per condition with at least 9 cells equally spaced between the insertion points of the intermandibularis muscle measured per fish. P values that are less than or equal to 0.05 between conditions are marked on the graph (in correspondence to the following key), to show which conditions are significantly different to one another. a = control, b = myod mutant, c = 3-5dpf MS222 anaesthetic treated, d = DMB treated, e = vhl mutant zebrafish. Graphs show 95% confidence intervals. |

