
Fig. 2
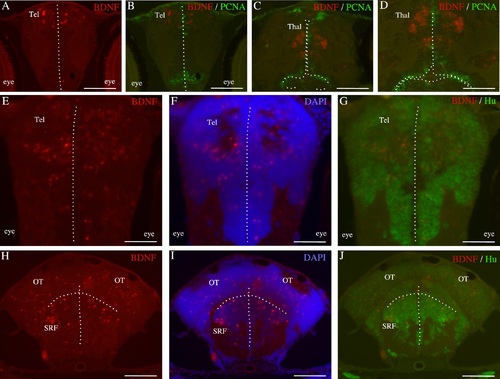
Immunohistochemical characterization of bdnf-expressing cells in the brain of 7 days old zebrafish larvae. Double staining for bdnf mRNA (red) and PCNA protein (green) on cross-sections through the telencephalon (A-B) and the thalamus (C-D). Double staining for bdnf mRNA (red) and the neuronal marker Hu (green) in the thalamus (E,F and G), the optic tectum (H, I and J) and at the level of the superior reticular formation (H, I and J). In F and I cells nuclei are counterstained with DAPI. The dotted lines indicate the ventricles. OT: optic tectum; SRF: superior reticular formation; Tel: telencephalon; Thal: thalamus. Scale bar: 150 µm in H, I and J. 120 µm in A, B, C. 60 µm in D, E, F and G. |