
Fig. S6
- ID
- ZDB-FIG-160727-24
- Publication
- Kim et al., 2016 - Recruitment of Rod Photoreceptors from Short-Wavelength-Sensitive Cones during the Evolution of Nocturnal Vision in Mammals
- Other Figures
- All Figure Page
- Back to All Figure Page
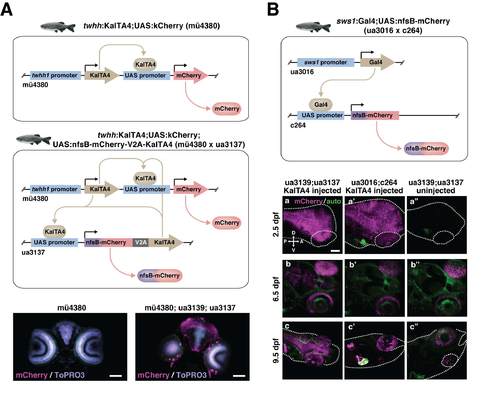
Validation of the Kaloop System, related to Figure 6. The expression of efna5a activates twhh1 promoter, which in turn would induce transgene under UAS. (A) The mü4380 zebrafish line was initially recovered from an enhancer trap screen (Distel et al., 2009). In mü4380, developmentally early (20-30 hpf) activation of the nearby endogenous efna5a gene induces twhh-driven production of KalTA4, which acts upon the UAS promoter to drive expression of the reporter fluorescent protein mCherry. This source of KalTA4 can also act upon the reporter element of the ua3137 construct. Cryosections of 13 dpf mü4380 or mü4380 x ua3137 larvae were imaged. The regions of magenta fluorescence detected only in the mü4380 x ua3125 larvae provide one line of validation for the lineage tracing function of the Kaloop construct. Cyan shows nuclear stain by ToPRO3. Scale bar: 40 µm. (B) Larval ua3139;ua3137 (Kaloop; see Figure 6A) and ua3016;c264 zebrafish were injected with KalTA4 mRNA as single-celled zygotes shortly after fertilization, and the level of global mCherry fluorescence is shown at three time points, most visible in the brain. Fluorescence is maintained over time in the Kaloop line but not the ua3016;c264 line, providing further validation that the Kaloop construct has lineagetracing functionality. In green is manually enhanced autofluorescence, to provide a landmark in each image. In the some cases, extra green fluorescence can be seen in the heart; this is a reporter gene built into the inserted construct which serves only to identify carriers of the [sws1:KalTA4] or [sws1:Gal4] transgene. In the c264, there is an additional red heart marker which can be seen in some images, which identifies carriers of the [UAS:nfsbmCherry] c264 transgene. dpf, days post fertilization; D, dorsal; V, ventral; T, temporal; N, nasal. Scale bar: 50 µm. |
Reprinted from Developmental Cell, 37, Kim, J.W., Yang, H.J., Oel, A.P., Brooks, M.J., Jia, L., Plachetzki, D.C., Li, W., Allison, W.T., Swaroop, A., Recruitment of Rod Photoreceptors from Short-Wavelength-Sensitive Cones during the Evolution of Nocturnal Vision in Mammals, 520-532, Copyright (2016) with permission from Elsevier. Full text @ Dev. Cell