
Fig. 6
- ID
- ZDB-FIG-160314-17
- Publication
- Yao et al., 2016 - Visual Cue-Discriminative Dopaminergic Control of Visuomotor Transformation and Behavior Selection
- Other Figures
- All Figure Page
- Back to All Figure Page
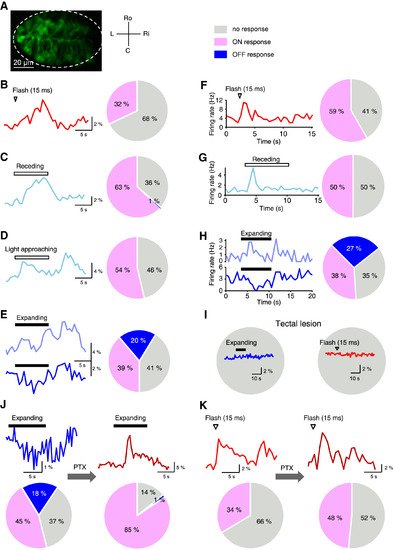
Properties of HC Dopaminergic Neurons’ Visual Responses (A) In vivo confocal image of a 6-dpf Tg (DAT:Gal4,UAS:GCaMP5) larva showing GCaMP5 expression in HC dopaminergic neurons. Single optic slice at the middle layer of the HC was imaged. The dashed ellipse outlines the HC. C, caudal; L, left; Ri, right; Ro, rostral. (B-E) In vivo calcium imaging data showing flash-evoked (B), receding-evoked (C), light approaching-evoked (D), and expanding stimulus-evoked (E) responses of HC dopaminergic neurons. Left panels, sample traces from the same larva. Each trace is the average of all responsive trials from all responsive neurons in the fish, except the traces in (E), which are the average of all ON-response trials (top) and all OFF-response trials (bottom), respectively. Right, pie charts showing the distribution of response types. ON response, OFF response, and no response are presented by pink, blue, and gray colors, respectively. Data were obtained from 405 HC dopaminergic neurons in 15 larvae. (F-H) In vivo cell-attached recording data showing flash-evoked (F), receding-evoked (G), and expanding stimulus-evoked (H) responses of HC neurons. Left, sample traces showing the response pattern of responsive neurons. Each trace is the average of 4 (F) or 5 (G and H) trials. Right, pie charts showing the distribution of response types. Data were obtained from 49 (F), 38 (G), and 52 (H) HC neurons. (I) Effect of bilateral lesion of the optic tectum on expanding stimulus- and flash stimulus-evoked responses of HC dopaminergic neurons. Data were obtained from 155 HC neurons in 5 larvae. Traces on pie charts represent typical responses from 42 (left) and 35 (right) cells. (J and K) Effect of local puffing of PTX into the HC on expanding stimulus-evoked (J) and flash stimulus-evoked (K) responses of HC dopaminergic neurons. Data were obtained from 155 neurons in 6 larvae. (J) Inhibition blockade effect on expanding stimulus-evoked responses of HC dopaminergic neurons. Top, sample traces from the same 7 cells showing expanding stimulus-evoked calcium responses before (left) and after (right) local puffing of PTX into the HC. Bottom, pie charts showing response type distribution of HC dopaminergic neuron before (left) and after (right) PTX application. (K) Effect of inhibition blockade on flash-evoked responses of HC dopaminergic neurons. Top, sample traces from the same 2 cells showing flash-evoked calcium responses before (left) and after (right) local puffing of PTX into the HC. Bottom, pie charts showing response type distribution of HC dopaminergic neuron before (left) and after (right) PTX application. See also Figure S7 and Tables S1–S5. |