
Fig. 4
- ID
- ZDB-FIG-160226-43
- Publication
- Buckley et al., 2016 - Reversible Optogenetic Control of Subcellular Protein Localization in a Live Vertebrate Embryo
- Other Figures
- All Figure Page
- Back to All Figure Page
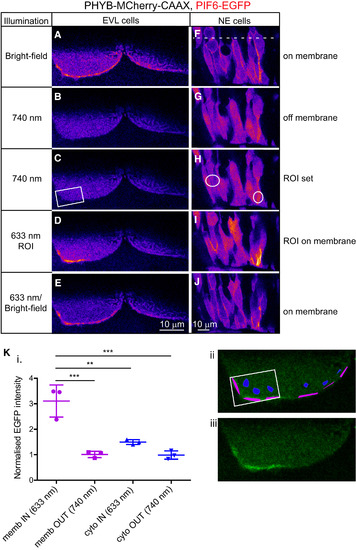
Subcellular Control of Protein Localization (A–J) Sequences of single confocal slices through two EVL cells of a 14-somite embryo (A–E) and a collection of NE cells (F–J). Cells were labeled with PIF6-EGFP and PHYB-MCherry-CAAX. Dotted line denotes developing midline of the neural rod. Only the PIF6-EGFP signal is shown and is pseudo-colored with the Fire look-up table. (A and F) PIF6-EGFP distribution in uniform BF light. (B and G) PIF6-EGFP distribution in uniform 740 nm light for 2 min (EVL) or 4 min (NE). (C and H) Position of ROIs (white rectangle and circles) before 633 nm illumination. (D and I) PIF6-EGFP distribution after 633 nm light was specifically delivered within the ROIs for 30 s (EVL) and 15 min (NE). A uniform background illumination of 740 nm light was also present. PIF6-EGFP was specifically recruited to regions of 633 nm light in three of three EVL cells and eight of eight NE cells. (E and J) PIF6-EGFP distribution following uniform 633 nm light for 1 min (EVL) or BF light for a few seconds (NE). (K) (i) Quantification of PIF6-EGFP intensity inside (IN) and outside (OUT) the 633 nm ROI from the image depicted in (D). EGFP intensity was normalized to mean levels outside the 633 nm ROI. A one-way ANOVA with Tukey’s multiple comparison test was carried out (***p < 0.001, **p < 0.01). Error bars denote SEM. EGFP intensity at the membrane (memb) inside the 633 nm ROI was significantly higher than all other regions of the cell. EGFP intensities in other regions of the cell were not significantly different to one another. (ii) Illustration of the sample areas of membrane (shown in purple) and cytoplasm (shown in blue) assessed for EGFP intensity inside and outside the 633 nm ROI (white rectangle). (iii) Raw image of (ii). |
Reprinted from Developmental Cell, 36, Buckley, C.E., Moore, R.E., Reade, A., Goldberg, A.R., Weiner, O.D., Clarke, J.D., Reversible Optogenetic Control of Subcellular Protein Localization in a Live Vertebrate Embryo, 117-126, Copyright (2016) with permission from Elsevier. Full text @ Dev. Cell