
Fig. 2 S1
- ID
- ZDB-FIG-160215-40
- Publication
- Yokota et al., 2015 - Endothelial Ca(2+) oscillations reflect VEGFR signaling-regulated angiogenic capacity in vivo
- Other Figures
- All Figure Page
- Back to All Figure Page
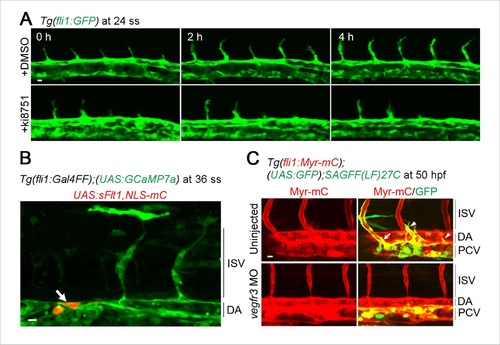
Defects in blood vessels and lymphatic vessels found in Vegfr2- or Vegfr3-inhibited embryos. (A) Confocal 3D images of Tg (fli1:GFP) embryos at 24 ss (first column), and the corresponding subsequent time-lapse images at the indicated time after treatment with DMSO or ki8751. Note that tip cell migration is blocked by treatment with ki8751. (B) Confocal stack fluorescence images of Tg(fli1:Gal4FF);(UAS:GCaMP7a) embryos at 36 ss injected with UAS:sFlt1,NLS-mC plasmid which drives the expression of both sFlt1 and NLS-mC simultaneously in ECs in a mosaic manner via a Gal4/UAS-based bidirectional expression system. GCaMP7a (green) and NLS-mC (red) images are shown. ISV sprouting from the DA was inhibited in the region close to sFlt1- and NLS-mC-co-expressing ECs (arrow). (C) Confocal stack fluorescence images of Tg (fli1:Myr-mC);(UAS:GFP);SAGFF(LF)27C embryos at 50 hr postfertilization (hpf) uninjected or injected with vegfr3 morpholino (MO). These Tg embryos express myristoylation signal (Myr)-tagged mCherry (red) in all ECs and GFP (green) in venous ECs. Note that the secondary sprouts (arrowheads) and secondary sprout-derived venous vessels (arrows) from the PCV were observed in uninjected embryos but not in vegfr3 morphants. Scale bars, 10 µm in A–C. ISV, intersomitic vessel; DA, dorsal aorta; PCV, posterior cardinal vein. |