
Fig. S2
- ID
- ZDB-FIG-160212-53
- Publication
- Beerman et al., 2015 - Direct In Vivo Manipulation and Imaging of Calcium Transients in Neutrophils Identify a Critical Role for Leading-Edge Calcium Flux
- Other Figures
- All Figure Page
- Back to All Figure Page
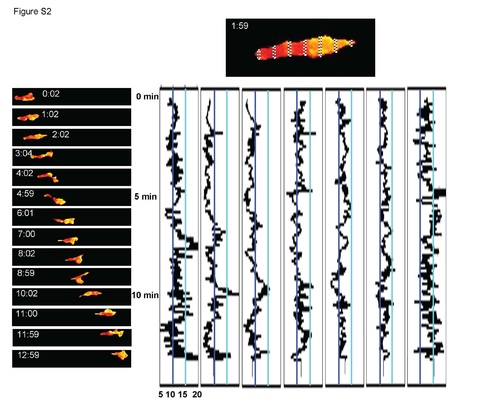
(Relates to Figure 1). Detailed analysis of calcium activity profile from a migrating neutrophil. The top image of a cell illustrates how the boxes L=4, 20, 36, 52, 68, 84, and 100 from Figure S1 were rotated, stretched, and magnified to highlight the enriched calcium flux at the leading edge, and to a lesser extent the lagging edge over time. The y axis is time (min) and the x axis is the GCaMP3/dsRed ratio oriented such that the turquoise line shows a visual threshold of the ratio at 15 and the dark-blue line shows a visual threshold of the ratio at 10. The time-lapse ratiometric cell images on the left correspond approximately to the time axis on the calcium activity profiles to provide a visual readout of the quantified signal graphed adjacently. |