
Fig. 3
- ID
- ZDB-FIG-160208-31
- Publication
- Almeida et al., 2015 - Intersectional Gene Expression in Zebrafish Using the Split KalTA4 System
- Other Figures
- All Figure Page
- Back to All Figure Page
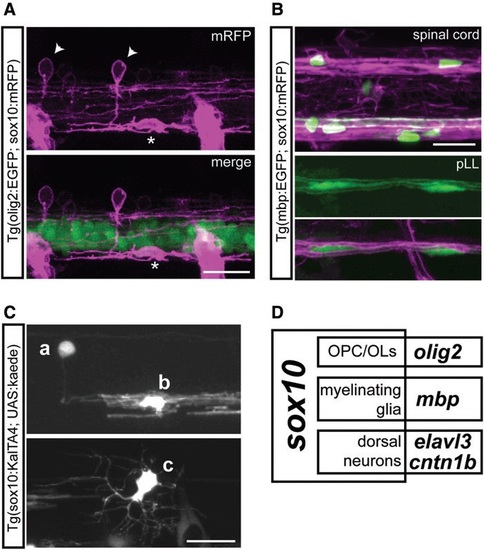
Reporter transgenes indicate expression of sox10 in several cell types. (A) Lateral view of the spinal cord of 2 dpf Tg(olig2: EGFP; sox10:mRFP) larva. Arrowheads: examples of sox10:mRFP+ dorsal neurons; asterisk: example of olig2:GFP+ sox10:mRFP+ OPC. (B) Lateral view of the spinal cord (top) and pLL (bottom) of 4 dpf Tg(mbp:EGFP; sox10:mRFP) larva. Many OPCs become mbp:EGFP+ mature OLs by 4 dpf in the spinal cord, and are associated with sox10:mRFP myelin sheaths, as are mbp:EGFP+ Schwann cells in the pLL. (C) Lateral view of the spinal cord of 3 dpf Tg(sox10:KalTA4; UAS:kaede) larva. Cell a: dorsal neuron; cell b: OL; cell c: OPC. (D) Venn Diagram of the expression patterns of sox10, olig2, mbp, elavl3, and cntn1b, indicating some of the cell types found in the intersection of each subdomain. All scale bars: 20 µm. OL, oligodendrocyte; OPC, oligodendrocyte precursor cell. |