
Fig. 2
- ID
- ZDB-FIG-151229-13
- Publication
- Newman et al., 2015 - Embryonic oxidative stress results in reproductive impairment for adult zebrafish
- Other Figures
- All Figure Page
- Back to All Figure Page
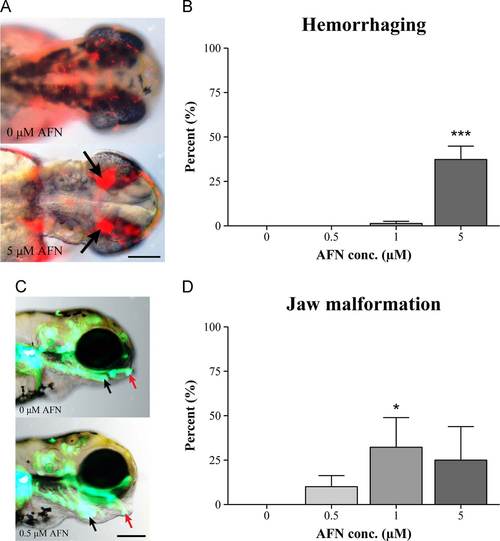
AFN-induced developmental defects. (A) Images of Tg(gata1:DsRed) embryos at 2 dpf (dorsal view) in which the blood is labeled by DsRed fluorescence, DMSO control is top and 5 µM AFN is bottom. Arrows indicate the increased fluorescent signal indicating hemorrhaging. Scale bar: 100 µm. (B) Hemorrhaging at 3 dpf following static AFN exposure beginning at 6 hpf, given as the percentage of larvae with the phenotype out of the total number of larvae at each time point. (C) Images of Tg(sox10:EGFP) embryos at 4 dpf (lateral view), DMSO control is top and 0.5 µM AFN is bottom. Arrows indicate malformation of the ceratohyal (black) and Meckel′s (red) facial cartilage. Scale bar: 100 µm. (D) Jaw defects at 4 dpf following static AFN exposure beginning at 6 hpf, given as the percentage of larvae with the phenotype out of the total number of larvae at each time point. The values in B and D represent the mean percentage±SEM for five biological replicates with each treatment group containing on average 40 embryos. Statistically significant differences are noted as *p≤0.05 (1 µM), and ***p≤0.001. |