
Fig. 3
- ID
- ZDB-FIG-151123-6
- Publication
- Hamling et al., 2015 - Mapping the development of cerebellar purkinje cells in zebrafish
- Other Figures
- All Figure Page
- Back to All Figure Page
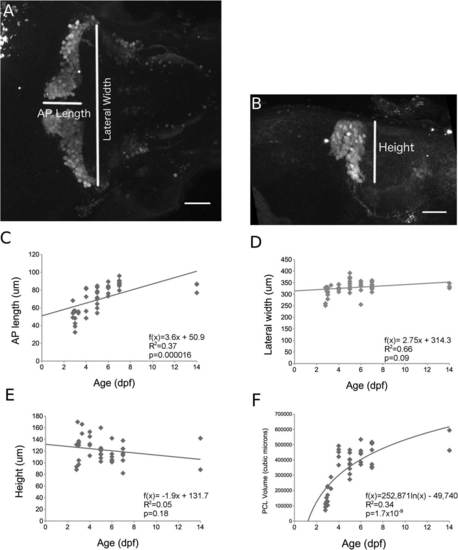
Average Purkinje cell layer anterior–posterior length and volume change during early development. Sample image shows anterior–posterior length (AP length), lateral width (A) and height (B) measurements in a 5 dpf larva. (C) Scatter plot of AP length (µm) between 2.8 and 14 dpf. AP length increased linearly with increasing age (p = 0.000016). (D) Lateral width (µm) did not significantly change between 2.8 and 14 dpf (p = 0.09). (E) Purkinje cell layer height did not significantly change with age (p = 0.18). (F) Purkinje cell layer (PCL) volume (µm3) increased logarithmically between 2.8 and 14 dpf (p = 1.7 × 10⁹). Curve estimates represent linear (C, D, E) or logarithmic regression (F). Scale bars 50 µm. Images taken using 20× (1.0 NA) water objective. Sample sizes for each time point (number of animals) are as follows: 2.8 dpf = 3; 2.9 dpf = 2; 3 dpf = 5; 3.3 dpf = 2; 4 dpf = 5; 5 dpf = 9; 6 dpf = 6; 7 dpf = 8; 14 dpf = 3. In 3E, 5 dpf = 8. In 3D, 7 dpf = 9. In 3E, 14 dpf = 2. |