
Fig. 1
- ID
- ZDB-FIG-151112-1
- Publication
- Sapp et al., 2014 - Fructose leads to hepatic steatosis in zebrafish that is reversed by mTOR inhibition
- Other Figures
- All Figure Page
- Back to All Figure Page
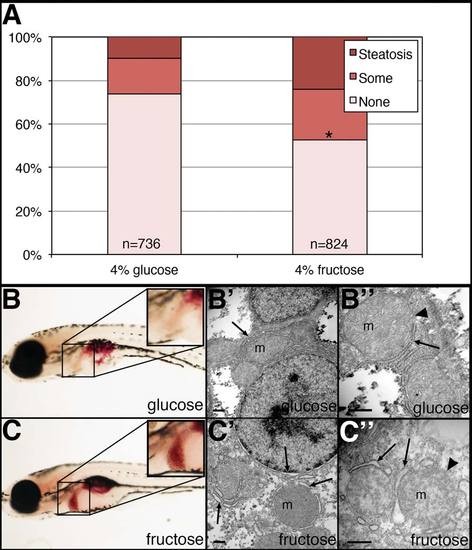
NASH-like phenotype in zebrafish larvae treated in fructose. Larvae were placed in 4% fructose or isocaloric 4% glucose at 5 dpf, then examined at 7 dpf. Larvae were fixed and then stained with ORO and the amount of steatosis was quantified. Larvae for electron microscopy were fixed in buffered glutaraldehyde, processed, and examined. (A) Quantification of hepatic steatosis in 4% glucose and 4% fructose-treated larvae. Larvae were examined in a blinded fashion and were categorized as having “steatosis,” “some” steatosis, or “none.” Shown are the percentages of each category in the glucose- and fructose-treated larvae, with the total number of larvae examined noted. Larvae with steatosis or some steatosis are increased in the fructose-treated larvae in a highly significant manner (*P ~ 0, chi-square analysis). (B) ORO staining of glucose-treated larva, showing “some” liver steatosis (inset). (B′, B") Electron micrographs of liver from glucose-treated larva, showing normal mitochondria (m), normal endoplasmic reticulum (arrow), and normal mitochondrial membrane (arrowhead). (C) ORO staining of fructose-treated larva, showing steatosis in the liver (inset). (C′, C") Electron micrographs of liver from fructose-treated larva, showing mitochondria (m), dilated endoplasmic reticulum (arrow), and less distinct mitochondrial membrane (arrowhead). Scale bars = 500 nm. |
| Fish: | |
|---|---|
| Condition: | |
| Observed In: | |
| Stage: | Days 7-13 |