
FIGURE
Fig. 2
- ID
- ZDB-FIG-150824-18
- Publication
- Gómez-Marín et al., 2015 - Evolutionary comparison reveals that diverging CTCF sites are signatures of ancestral topological associating domains borders
- Other Figures
- All Figure Page
- Back to All Figure Page
Fig. 2
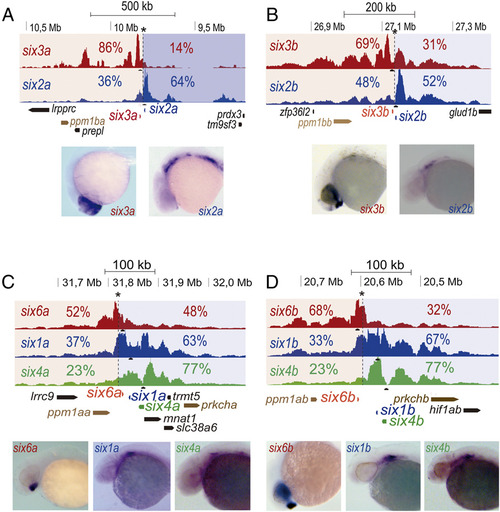
All four zebrafish six clusters are divided in two different 3D compartments. (A–D) 4C-seq on whole zebrafish embryos at 24 hpf from the different six genes at each cluster (black triangles). Border regions are indicated by an asterisk, and the two 3D compartments are shaded in red and blue. Contact percentages for each gene on the two 3D compartments are shown. Expression patterns of each gene at 24 hpf are shown for each gene below the 4C-seq tracks. (A) six3a/six2a cluster. (B) six3b/six2b cluster. (C) six6a/six1a/six4a cluster. (D) sixba/six1b/six4b cluster. |
Expression Data
Expression Detail
Antibody Labeling
Phenotype Data
Phenotype Detail
Acknowledgments
This image is the copyrighted work of the attributed author or publisher, and
ZFIN has permission only to display this image to its users.
Additional permissions should be obtained from the applicable author or publisher of the image.
Full text @ Proc. Natl. Acad. Sci. USA