
Fig. S1
- ID
- ZDB-FIG-150513-9
- Publication
- Tang et al., 2015 - Chitin Is Endogenously Produced in Vertebrates
- Other Figures
- All Figure Page
- Back to All Figure Page
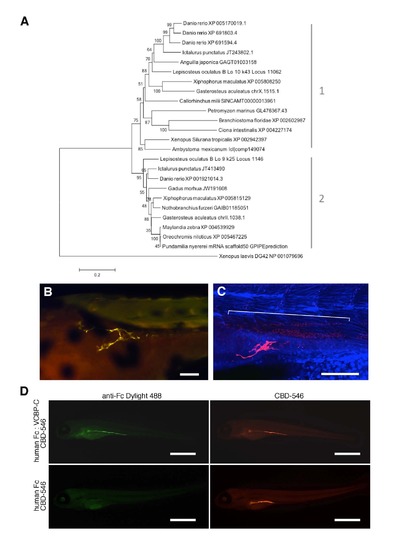
Evolutionary relationships of vertebrate chitin synthases, chitin in 3 dpf zebrafish larvae, and validation of the CBD probe specificity. (A) Amino acid sequences used in this analysis are described in Table S1 and were aligned with Clustal Omega; alignments were manually adjusted to eliminate gaps. The tree was rooted using a hyaluronan synthase gene (DG42) from Xenopus laevis. The evolutionary history was inferred using the Neighbor-Joining method of MEGA5 [S1]. The optimal tree with the sum of branch length = 4.49862894 is shown. The percentage of replicate trees in which the associated taxa clustered together in the bootstrap test (1000 replicates) is shown next to the branches. The tree is drawn to scale, with branch lengths in the same units as those of the evolutionary distances used to infer the phylogenetic tree. The evolutionary distances were computed using the Poisson correction method and are in the units of the number of amino acid substitutions per site. The analysis involved 25 amino acid sequences. All positions with less than 95% site coverage were eliminated. That is, fewer than 5% alignment gaps, missing data, and ambiguous bases were allowed at any position. There were a total of 440 positions in the final dataset. Two general CHS clades resulted from this (and other) analyses (though Clade 1 was not supported with a high bootstrap value). The tree shown should not be taken as a rigorous phylogenetic analysis since the sequence data and taxon sampling were incomplete. Rather, it shows the relationship of chitin synthase sequences among vertebrates; a more in-depth phylogenetic analysis of metazoan chitin synthases can be found in [S2]. (B, C) Chitin affinity histochemistry in 3 dpf zebrafish larva (rostral is left) shows chitin in the developing anterior gut forming discrete fiber-like structures. The specimen in (B) was imaged on an epifluorescent microscope. CBD-546 is shown in yellow, and all other fluorescent signals are from background fluorescence. A different specimen probed with CBD-546 (red), counterstained with TOTO-3 (blue), and imaged by confocal microscopy is shown in (C). In addition to the chitin fibers in the developing anterior gut, the chitin probe also bound to a presumptive endodermal cell population (indicated by the bracket). Scale bars = 100 µm. (D) Validation of the chitin specificity of our CBD probe by codetection with a completely different chitin binding domain reagent. A probe consisting of the chitin-binding fragment of the variable chitin-binding protein-C from Ciona intestinalis [S3] was linked to a human Fc region (human Fc:VCBP-C) and used together with our Bacillus circulans chitinase-derived CBD-546 probe in a single histochemical reaction on 5 dpf zebrafish larvae. A Dylight 488-labeled goat anti-human Fc antibody was used to detect the Fc portion of the probe. A single specimen treated with both the VCBP-C probe and the CBD-546 probe is shown in the top row. The binding pattern of the human Fc:VCBP-C probe was very similar to that of the CBD-546 probe. As a control, another probe containing only the human Fc fragment (no VCBPC) was used together with our CBD-546 probe in a histochemical reaction (bottom row). Detection with the same Dylight 488-labeled antibody revealed no signals from the human Fc fragment alone (the only signals are from autofluorescence), however, chitin was present as confirmed by the CBD-546 signals. Scale bars = 500 µm. |