
Fig. 4
- ID
- ZDB-FIG-150506-42
- Publication
- Cheng et al., 2014 - Myotonia Congenita-Associated Mutations in Chloride Channel-1 Affect Zebrafish Body Wave Swimming Kinematics
- Other Figures
- All Figure Page
- Back to All Figure Page
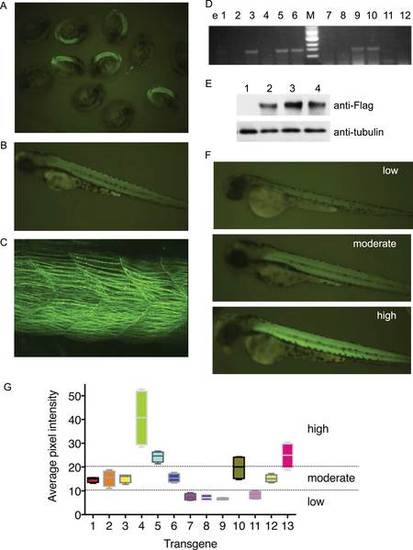
Characterization of stable transgenic zebrafish embryos using Tg (α-actin:hCLCN1I553F/H555N-EGFP). (A) A pool of 28 h dpf embryos from the stable transgenic founder fish showing the EGFP expression. Nonfluorescent embryos are nontransgenic siblings. (B) Embryos with positive EGFP expression show the muscle-specific expression in their trunk region. (C) Confocal microscopic image of the trunk of an F1 generation Tg (α-actin:hCLCN1I553F/H555N-EGFP) embryos at 3 dpf. EGFP expression was observed within the zebrafish muscle fibers. (D) Transgenic founders were confirmed by transmission of the CLCN1 transgene to F1 progeny by PCR. Transgenic founders were crossed with WT zebrafish, individual F1 embryos were lysed and PCR were performed using hCLCN1 specific primers and the PCR product analyzed by agarose gel electorphorsis. EGFP-positive embryos are identified based on the presence of the 1.5 kb band (e3, 5, 6, 9 and 10), while the EGFP-negative embryos lack this band (e1, 2, 4, 7, 8, 11 and 12). e; embryo. (E) Transgenic founders were confirmed by Western blot. Protein was extracted from F1 embryos at 2 dpf. Lane 1: WT AB Zebrafish, Lane 2-4: Individual stable transgenic fish expressing the 130 kDa Flag-tagged hCLCN1I553F/H555N-EGFP (see Materials and Methods). Actin was used as a loading control. (F) Transgenic zebrafish embryos at 3 dpf showing low, moderate or high expression of hCLCN1I553F/H555N-EGFP based on GFP intensity. (G) Quantification of hCLCN1I553F/H555N-EGFP expression and classification. For each transgene, 3 siblings of 3 dpf embryos were analyzed. Average pixel intensities (api) for EGFP fluorescence were determined on 5 areas of the trunk and the average for each sibling is plotted. Expression levels of the transgene were arbitrarily classified into low (<10 api), moderate (10-20 api) or high (>20 api). Similar results were obtained for the other transgenes (data not shown). |
| Gene: | |
|---|---|
| Fish: | |
| Anatomical Term: | |
| Stage: | Protruding-mouth |