
Fig. 4
- ID
- ZDB-FIG-150326-5
- Publication
- Progatzky et al., 2014 - Dietary cholesterol directly induces acute inflammasome-dependent intestinal inflammation
- Other Figures
- All Figure Page
- Back to All Figure Page
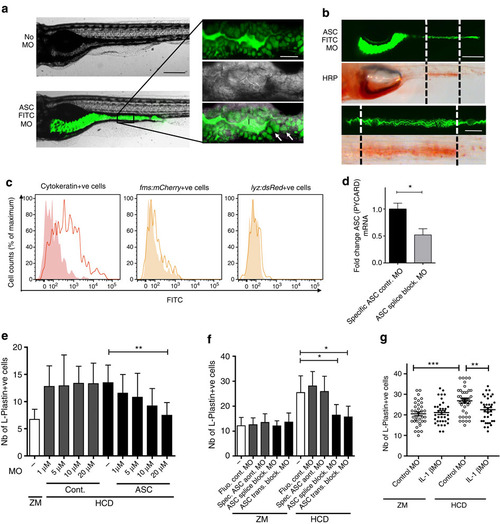
Treatment with ASC MO using a novel mode of delivery abrogates HCD-induced intestinal myeloid cell accumulation. (a) Representative fluorescent image of larvae treated with 20 µM FITC-conjugatedASC splice-blocking MO (FITC ASC MO, bottom panel) or left untreated (top panel). Insets highlight green fluorescence of FITC ASC MO in intestinal lumen (l) and in epithelial cells (white arrow). Scale bars, 100 µm (black); 20 µm (white). (b) Representative fluorescent and bright-field images of larvae treated with 20 µM FITC ASC MO (top panel) subsequently treated with 10 mg ml1 HRP for 2 h. HRP was detected histochemically (bottom panel) and found to be localized in the same region as the MO (indicated by black and white dotted lines). Insets show enlarged images of the region containing specialized enterocytes that have taken up FITC ASC MO and HRP. Scale bars, 100 µm (top); 50 µm (bottom). (c) Histograms depict FITC fluorescence in intestinal cells of larvae treated with 20 µM FITC ASC MO (solid line) or untreated (filled histogram) and double-stained for cytokeratin (left plot), gated on dsRed+ cells in Tg( lyz:dsRed) (middle) or mCherry+ cells in Tg( fms:mCherry) (right). Pool of ne10 larval intestines, representative of e2 experiments. (d) qRT–PCR analysis of FITC+ sorted intestinal cells of zebrafish larvae treated with either 20 µM of ASC-specific control MO or FITC ASC MO (pool of n=50–100 larval intestines per sample). Relative expression values were normalized to 18S and expressed as fold change relative to the control sample. Mean+s.e.m. of triplicates. Representative of two experiments. Mann–Whitney test. (e) Effect of increasing ASC or control MO concentration treatment on the total number of intestinal L-plastin+ cells. (f) Effect of different ASC MOs on the total number of intestinal L-plastin+ cells. (e,f) ne15, one exact experimental replicate and more than three experimental replicates for the highest concentration of MO. Mean+95% confidence intervals. Kruskal–Wallis test. (g) Effect of IL-1β MO treatment the total number of intestinal L-plastin+ cells. ne35, pooled from two experiments. Error bars: s.e.m. One-way analysis of variance. ***P<0.001, **P<0.01 and *P<0.05. |