
Fig. 4
- ID
- ZDB-FIG-150120-18
- Publication
- Shimizu et al., 2014 - Hipk2 and PP1c Cooperate to Maintain Dvl Protein Levels Required for Wnt Signal Transduction
- Other Figures
- All Figure Page
- Back to All Figure Page
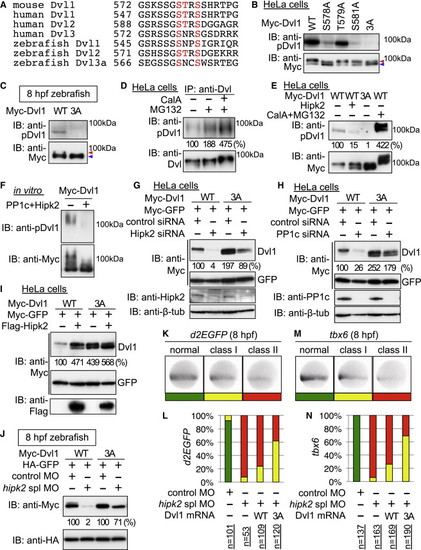
Hipk2-PP1c Stabilizes Dvl through Dephosphorylating the Conserved CK1 Sites (A) Amino acid sequence alignment of the C-terminal CK1 phosphorylation regions within vertebrate Dvl proteins. The potential CK1 phosphorylation sites are indicated by red letters. (B) Anti-pDvl1 recognizes the phosphorylation of the conserved CK1 sites on Dvl1 C-terminal region. HeLa cells were transfected with Myc-Dvl1 WT and mutants as indicated. Cell lysates were immunoblotted with indicated antibodies. To clearly show the migration-shift of Dvl proteins, equal quantities of Dvl proteins were resolved. (C) The conserved CK1 sites on Dvl are phosphorylated in zebrafish. Extracts were harvested from the embryos injected with Myc-tagged mouse Dvl1 WT and 3A mRNA at 8 hpf and immunoblotted with indicated antibodies. In (B) and (C), High and low level phosphorylated forms of Dvl are indicated with red and blue arrowheads, respectively. (D) Endogenous Dvl is phosphorylated at the conserved CK1 sites. HeLa cells were treated with DMSO () or 2 nM CalA and 10 μM MG132 for 3 hr. Cell extracts were subjected to immunoprecipitation with anti-Dvl1/2/3 (anti-Dvl). Immunoprecipitates were immunoblotted with indicated antibodies. (E) Hipk2-PP1c dephosphorylates Dvl at the conserved CK1 sites in vivo. HeLa cells were transfected with Myc-Dvl1 WT and 3A and Flag-Hipk2. The cells were then treated with DMSO () or 2 nM CalA and 25 μM MG132 for 3 hr. Cell lysates were immunoblotted with indicated antibodies. (F) Hipk2-PP1c directly dephosphorylates Dvl1 at the conserved CK1 sites. Aliquots of Dvl1 proteins were incubated with or without PP1c and Hipk2 and then immunoblotted with indicated antibodies. In (E) and (F), relative Dvl phosphorylation levels were calculated by determining the ratio of phospho-Dvl1 to total Dvl and these values are presented below the panels as the relative percentages. (G–J) Dvl1 3A is less sensitive to Hipk2 and PP1c than Dvl WT. In (G)–(I), HeLa cells were treated with or without control siRNA, Hipk2 siRNA#2, or PP1c siRNA#1 and then transfected with Myc-Dvl1 WT and 3A, Myc-GFP, and Flag-Hipk2. In (J), zebrafish embryos were injected with MOs with mouse Myc-Dvl1 and HA-GFP mRNA. Extracts were immunoblotted with indicated antibodies. Relative Dvl1 protein levels were calculated by determining the ratio of Dvl1 to GFP. These values are presented below the top panel as the relative percentages. (K–N) Hipk2 regulates the β-catenin pathway through Dvl dephosphorylation in zebrafish. In (K) and (M), classes of phenotypes induced by hipk2 spl MO injection are shown. In (K), class I, weak reduction of OTM:d2EGFP (d2EGFP); class II, strong reduction of d2EGFP. In (M), class I, weak reduction of tbx6; class II, strong reduction of tbx6. In (L) and (N), the distribution of phenotypes in 8 hpf OTM:d2EGFP-transgenic (L) or nontransgenic (N) zebrafish embryos injected with MOs with or without mouse Dvl1 WT or 3A mRNA (40 pg) is shown. n = the total number of MO-injected embryos. See also Figures S5 and S6. |