
Fig. 3
- ID
- ZDB-FIG-141208-1
- Publication
- Salta et al., 2014 - A Self-Organizing miR-132/Ctbp2 Circuit Regulates Bimodal Notch Signals and Glial Progenitor Fate Choice during Spinal Cord Maturation
- Other Figures
- All Figure Page
- Back to All Figure Page
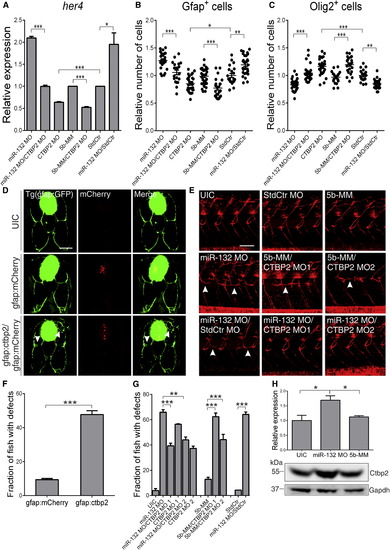
The miR-132 Morphant Phenotype Is Mediated through the Transcriptional Corepressor Ctbp2 (A) Semiquantitative real-time PCR analysis showing the effect of Ctbp2 downregulation on her4 levels (CTBP2 MO, splice blocking morpholino) in miR-132 morphant and control embryos at 24 hpf. Values were normalized to the geometric mean of ef1a, b2m, and actin and expressed as fold change compared to the control. (B and C) Effect of Ctbp2 downregulation using a splice blocking morpholino on the total number of Gfap+ (B) and Olig2+ (C) in the spinal cord of Ctbp2 morphant and control Tg(gfap:GFP) (B) or Tg(olig2:GFP) (C) embryos at 48 hpf. Each dot of the scatterplot represents the normalized average from four serial optical sections (z stacks) of one spinal cord cross-section per embryo. (D) Transverse trunk sections of Tg(gfap:GFP) larvae either UIC, overexpressing gfap:mCherry (mCherry under the gfap promoter), or gfap:ctbp2 (ctbp2 under the gfap promoter) in a mixture with gfap:mCherry at 72 hpf. Quantified in (F). Scale bar, 10 µm. Arrowheads indicate aberrant arborization of glial processes. (E) Zrf-1 immunostaining of whole mounts at 72 hpf, lateral views of trunk. StdCtr MO, standard control morpholino; CTBP2 MO1, translation blocking morpholino against Ctbp2; CTBP2 MO2, splice blocking morpholino against Ctbp2. Quantified in (G). Scale bar, 50 µm. Arrowheads indicate aberrant arborization of glial processes. (F) Quantification of glial arborization phenotype at 72 hpf in gfap:Ctbp2-overexpressing larvae and control larvae overexpressing gfap:mCherry. Sample size, n = 75 for gfap:Ctbp2; n = 71 for gfap:mCherry. (G) Quantification of glial arborization phenotype in miR132/Ctbp2 double morphants at 72 hpf. Sample sizes: n = 162 for UIC; n = 186 for miR-132 MO; n = 128 for CTBP2 MO1; n = 86 for miR-132 MO-CTBP2 MO1; n = 118 for CTBP2 MO2; n = 100 for miR-132 MO/CTBP2 MO2; n = 125 for 5b-MM; n = 70 for 5b-MM/CTBP2 MO1; n = 61 for 5b-MM/CTBP2 MO2; n = 120 for StdCtr; and n = 103 for miR-132 MO/StdCtr. (H) Western blot analysis of Ctbp2 protein levels in miR-132 morphants compared to control groups at 72 hpf. Protein levels were normalized against Gapdh. Values are presented as mean ± SEM. *p < 0.05; **p < 0.01; ***p < 0.001; ns, nonsignificant. See also Figure S4. |
| Gene: | |
|---|---|
| Antibody: | |
| Fish: | |
| Knockdown Reagents: | |
| Anatomical Terms: | |
| Stage: | Protruding-mouth |
| Fish: | |
|---|---|
| Knockdown Reagents: | |
| Observed In: | |
| Stage: | Protruding-mouth |
Reprinted from Developmental Cell, 30(4), Salta, E., Lau, P., Sala Frigerio, C., Coolen, M., Bally-Cuif, L., De Strooper, B., A Self-Organizing miR-132/Ctbp2 Circuit Regulates Bimodal Notch Signals and Glial Progenitor Fate Choice during Spinal Cord Maturation, 423-36, Copyright (2014) with permission from Elsevier. Full text @ Dev. Cell