
Fig. 1
- ID
- ZDB-FIG-140922-12
- Publication
- Sasaki et al., 2014 - Aberrant Autolysosomal Regulation Is Linked to The Induction of Embryonic Senescence: Differential Roles of Beclin 1 and p53 in Vertebrate Spns1 Deficiency
- Other Figures
- All Figure Page
- Back to All Figure Page
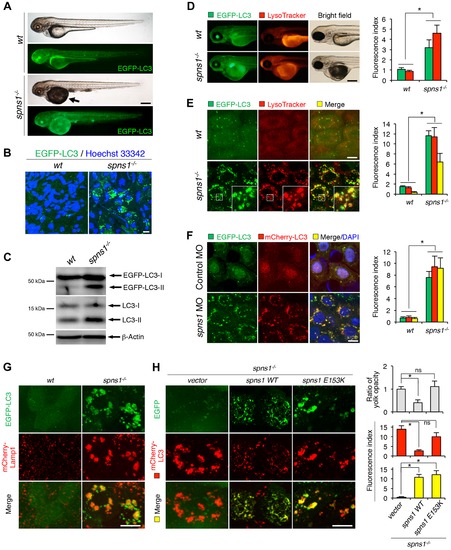
Aberrant autophagosome and autolysosome formation in spns1-mutant zebrafish. (A) Yolk opaqueness and LC3 puncta formation in spns1-mutant zebrafish embryos. For EGFP-LC3 transgenic spns1-mutant [Tg(CMV:EGFP-LC3);spns1hi891/hi891] fish siblings, bright-field and fluorescence images of wild-type (wt) control (upper) and spns1 mutant (spns1-/-) (lower) embryos at 84 hpf are shown. The black arrow indicates the yolk-opaqueness phenotype in the spns1 mutant. The gross expression of EGFP-LC3 at head and trunk in the spns1-mutant animal is relatively stronger than in the wt animal. Occasionally, however, a high intensity signal can be observed at the liver region in the mutant (as seen in D). Scale bar, 250 µm. (B) EGFP-LC3 punctate compartments in the liver cells of the spns1 mutant. Through high magnification (×600) confocal microscopy, intracellular EGFP-LC3 puncta were visualized in live animals at 84 hpf. Nuclei were counterstained with Hoechest 33342 (blue), and peri-nuclear EGFP-LC3 puncta were evident in the spns1 mutant, but not in wt animals. Scale bar, 10 μm. (C) Immunoblotting to detect the conversion of LC3-I to LC-II. Using an anti-LC3 antibody, both endogenous LC3 and transgenic (exogenous) EGFP-LC3 expression was detected and an increase of LC3-II conversion/accumulation was seen in the spns1 mutant compared with wt fish at 84 hpf. (D–F) Identification of autophagosome and autolysosome/lysosome formation in the spns1 mutant. (D, E) LysoTracker (DND-99; red) staining of EGFP-LC3 transgenic spns1-mutant [Tg(CMV:EGFP-LC3); spns1hi891/hi891] embryos was performed at 84 hpf. At the whole animal levels (D), the EGFP-LC3 signal is relatively higher throughout in the spns1 mutant than in wild type, and a particularly strong signal can be seen in the liver, as shown in (A). In the head and trunk portions of the animals (D), a distinctive increase in the intensity of LysoTracker can be observed in the spns1 mutant. At the intracellular level (E), several small LC3 spots and largely diffuse green signal in the cells and cytosolic LysoTracker staining is seen. A number of enlarged LC3- and LysoTracker-positive yellow punctate structures can be seen in the spns1 mutant by confocal microscopy at a higher magnification (inset; enlarged from dotted square area). (F) EGFP-LC3 and mCherry-LC3 double-transgenic [Tg(EGFP-LC3:mCherry-LC3)] zebrafish were used to monitor autolysosome formation in spns1 MO-injected embryos at 84 hpf. A number of enlarged yellow LC3 puncta were detected in the spns1 morphant, while only small yellow LC3 spots can be seen in control-injected embryos. Nuclei were counterstained with 42, 6-diamidino-2-phenylindole, dihydrochloride (DAPI). Scale bar, 250 μm in (D). Scale bar, 10 μm in (E, F). Quantification of data presented in D (n = 12), E (n = 6), and F (n = 6) is shown in the right graph; the number (n) of animals is for each genotype. Three independent areas (periderm or basal epidermal cells above the eye) were selected from individual animals. (G) Transgenic expression of mCherry-Lamp1 in wt [Tg(CMV:EGFP-LC3)] and spns1-mutant [Tg(CMV:EGFP-LC3);spns1hi891/hi891] animals 84 hpf. Scale bar, 10 µm. (H) Transgenic expression of EGFP-Vector (vector), EGFP-wild-type Spns1 (spns1 WT), or EGFP-mutant Spns1 (spns1 E153K) in [Tg(CMV:mCherry-LC3);spns1hi891/hi891] animals at 84 hpf. Scale bar, 10 μm. Quantification of data presented in H is shown for ratio of yolk opaqueness phenotype (n = 48), mCherry intensity (red) (n = 6), and merge intensity of EGFP and mCherry (yellow) (n = 6) in the right graphs; the number (n) of animals is for each genotype. Three independent areas (periderm or basal epidermal cells above the eye) were selected from individual animals. Error bars represent the mean ± standard deviation (S.D.), *p<0.005; ns, not significant. |
| Genes: | |
|---|---|
| Fish: | |
| Knockdown Reagent: | |
| Anatomical Terms: | |
| Stage: | Protruding-mouth |
| Fish: | |
|---|---|
| Knockdown Reagent: | |
| Observed In: | |
| Stage: | Protruding-mouth |