
Fig. 7
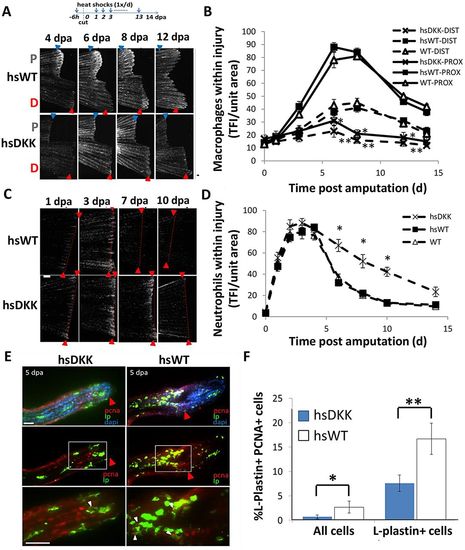
Wnt/β-catenin signaling regulates leukocyte response to injury. (A) The loss-of-function Wnt/β-catenin signaling line Tg(hsDKK1:GFP) crossed to the Tg(mpeg1:mCherry) line was used to track macrophages after Wnt modulation. Resected wild-type or loss-of-function Wnt/β-catenin signaling (hsDKK) fins received a proximal cut and a distal cut. Representative images are shown of macrophage accumulation through 12dpa. Fluorescent images were acquired and converted to grayscale for ease of visualization. (B) Macrophage accumulation was reduced in DKK1-overexpressing fins at every time point from 3dpa until 14dpa and no significant difference in macrophage number was observed between proximal and distal resections. Data are representative of at least three independent experiments with at least six to eight fish per time point. HsDKK-PROX versus hsWT-PROX, WT-PROX: 6dpa, *P=0.0083; 8dpa, *P=0.0072; 12dpa, P=0.0175. HsDKK-DIST versus WT-DIST, WT-DIST; 6dpa, **P=0.0140; 8dpa, **P=0.0195; 12dpa, **P=0.0361; two-tailed t-test. (C) Tg(hsDKK1:GFP) was crossed to a neutrophil promoter-driven Tg(lyzC:dsRed) line in order to visualize neutrophil accumulation following Wnt inhibition. Representative images indicate that neutrophil accumulation remains elevated longer in DKK1-overexpressing fins compared with wild-type controls. (D) Neutrophil accumulation was higher in DKK1-overexpressing fins compared with wild-type controls after 5dpa. Data are representative of three independent experiments with at least six to eight fish per time point/condition. hsDKK1 versus hsWT, WT: 6dpa, *P=0.0075; 8dpa, *P=0.0112; 10dpa, *P=0.0105; two-tailed t-test. (E) Proliferation of wild-type and DKK1-overexpressing regenerates at 5dpa as assessed by anti-PCNA (red), anti-L-plastin (green) and DAPI (blue) staining. Red arrowheads indicate original cut site; white arrowheads indicate double-stained (PCNA+ LP+) cells. The boxed regions are magnified beneath. (F) Proliferating macrophages as a percentage of total cells and total macrophages (LP+ cells). Numbers were averaged over at least seven sections of each sample. Data are representative of three independent experiments (n>5). hsDKK1 versus hsWT: *P=0.0475; **P=0.0349 (two-tailed t-test, error bars indicate s.e.m.). Scale bars: 200μm in A; 300μm in C; 20μm in E. |