
Fig. 1
- ID
- ZDB-FIG-140617-3
- Publication
- Veneman et al., 2013 - A zebrafish high throughput screening system used for Staphylococcus epidermidis infection marker discovery
- Other Figures
- All Figure Page
- Back to All Figure Page
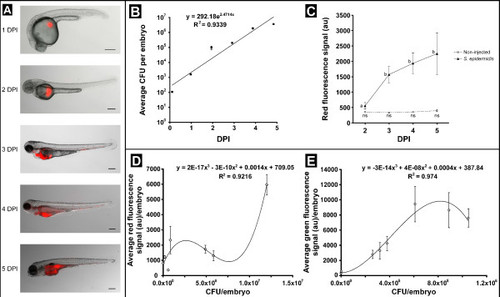
Quantitation of fluorescence intensity in S. epidermidis-injected embryos using the COPAS system. Panel A: Bright field /fluorescence overlay images of mCherry-labelled S. epidermidis. Wild type zebrafish embryos injected with 100 CFU of S. epidermidis O-47 into the yolk at 2 HPF were imaged at 5 time points from 1 to 5 DPI, scale bar is 250 µm. Panel B: CFU counts of S. epidermidis-infected embryos. Groups of 10 embryos were homogenized and plated directly after injection until 5 DPI. Panel C: The graphs represent the average fluorescence intensity from the entire group of non-injected and S. epidermidis-injected embryos, from 2 DPI until 5 DPI. An increase in fluorescence intensity is visible during this infection period. (Error bars = SEM). Different letters indicate statistical significant differences (P<0.001). Panels D and E: Correlation between CFU counts and fluorescence intensity of embryos infected with mCherry-labelled (D) and GFP-labelled (E) bacteria. Pools of 10 infected embryos between 2 and 5 DPI were homogenized and plated. The average fluorescence intensity is plotted against the CFU count. |