
Fig. 2
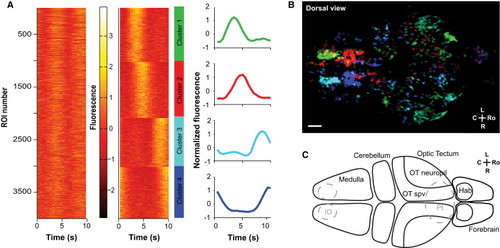
Clustering of Fluorescence Traces Reveals Four Temporal Clusters (A) Activity traces of all ROIs can be grouped in four clusters. Left: activity for all ROIs of a fish (in rows); for each ROI, the normalized, average activity across all stimulus repetitions is shown. Center: ROIs sorted according to the cluster they fall into. Right: average of the Z score traces for each cluster. See also Figure S3. (B) Anatomical distribution of activity clusters in one fish. Sum projection showing the distribution of the four clusters of activity in the same fish as in (A), with colors corresponding to the color traces in (A). Scale bar, 50 μm. (C) Schematic outlining relevant brain regions in the zebrafish larvae, in a dorsal view. OT, optic tectum; OT spv, optic tectum stratum periventriculare; IO, inferior olive; Pt, pretectal area; Hab, habenula. Gray dashed lines demarcate areas located more ventrally. |