
Fig. 2
- ID
- ZDB-FIG-140423-3
- Publication
- Liu et al., 2013 - Selection of Reliable Biomarkers from PCR Array Analyses Using Relative Distance Computational Model: Methodology and Proof-of-Concept Study
- Other Figures
- All Figure Page
- Back to All Figure Page
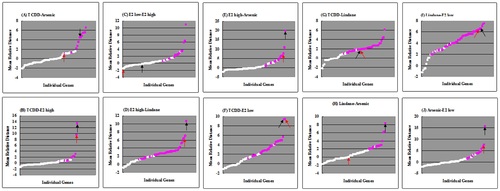
Mean Relative Distances (RDs) between two chemicals/concentration groups. (A) TCDD vs. Arsenic; (B) TCDD vs. E2_high; (C) E2_low vs. E2_high; (D) E2_high vs. Lindane; (E) E2_high vs. Arsenic; (F) TCDD vs. E2_low; (G) TCDD vs. Lindane; (H) Lindane vs. Arsenic; (I) Lindane vs. E2_low; (J) Arsenic vs. E2_low. Black arrows indicate the positions of vtg1, and red arrows indicate the positions of cyp1a1; White boxes indicate the positions of genes that did not pass the model test and could not be used to discriminate the corresponding two chemicals/concentrations; Pink boxes indicate the positions of genes that passed the model test and could be used to discriminate the corresponding two chemicals/concentrations. TCDD: 5 nM 2,3,7,8-tetrachlorodibenzo-p-dioxin; lindane: 100 µg/L lindane; arsenic: 15 mg/L arsenic; E2_low: 5 µg/L 17β estradiol; E2_high: 50 µg/L 17β-estradiol. The information of RDs and the corresponding genes can be found in Table S3. |