
Fig. 5
- ID
- ZDB-FIG-140131-26
- Publication
- Antinucci et al., 2013 - Teneurin-3 specifies morphological and functional connectivity of retinal ganglion cells in the vertebrate visual system
- Other Figures
- All Figure Page
- Back to All Figure Page
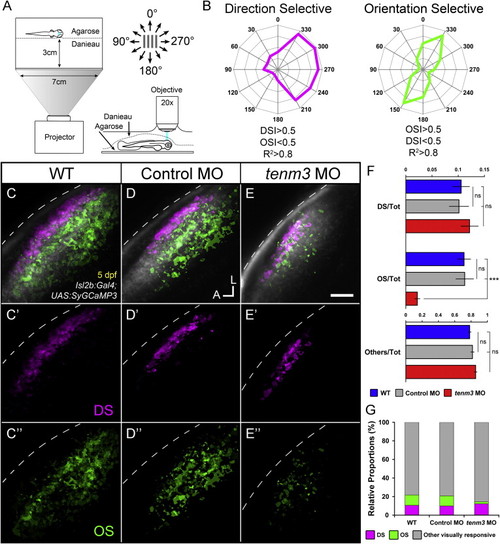
Impaired Development of Orientation-Selective RGCs Following teneurin-3 Knockdown (A) Schematic describing the experimental setup. Larvae were immobilized in agarose and placed with one eye facing a screen, where drifting bars moving in 12 directions were projected. Visually evoked SyGCaMP3 responses were recorded in the contralateral tectal neuropil. (B) Polar plots of representative direction-selective (DS, magenta) and orientation-selective (OS, green) voxels showing relative integral responses to moving bars. Criteria employed to characterize the two classes of voxels are reported at the bottom. (C-E) Composite parametric maps across multiple 5 dpf Tg(Isl2b:Gal4;UAS:SyGCaMP3) larvae representing the spatial distribution of DS (magenta) and OS (green) voxels within each group (WT n = 8 larvae; control MO n = 11; tenm3 MO n = 20). Within individual parametric maps, voxel brightness is proportional to the summed incidence of each functional response across all larvae imaged. The standard space template image derived for each group (grayscale) provides an anatomical reference. Dashed lines indicate the skin overlaying the tectum. Scale bar, 20 µm. A, anterior; L, lateral. (C′-E′) Parametric maps for DS voxels only. (C′′′-E′′) Parametric maps for OS voxels only. (F) Bar graphs showing the ratios between defined voxel classes and total visually responsive voxels (Tot) within each group (WT n = 8 larvae; control MO n = 11; tenm3 MO n = 20). Non-DS and non-OS voxels are classified as “others.” All graphs show mean values ± SEM. p < 0.001; ns, not significant by one-way ANOVA followed by Tukey’s HSD test. (G) Bar graph showing the proportions of DS and OS voxel classes relative to visually responsive voxels within each group.See also Figures S2-S4 and Movies S1, S2, and S3. |
| Gene: | |
|---|---|
| Fish: | |
| Knockdown Reagent: | |
| Anatomical Terms: | |
| Stage: | Day 5 |
| Fish: | |
|---|---|
| Knockdown Reagent: | |
| Observed In: | |
| Stage: | Day 5 |