
Fig. 3
- ID
- ZDB-FIG-140122-24
- Publication
- Venkiteswaran et al., 2013 - Generation and Dynamics of an Endogenous, Self-Generated Signaling Gradient across a Migrating Tissue
- Other Figures
- All Figure Page
- Back to All Figure Page
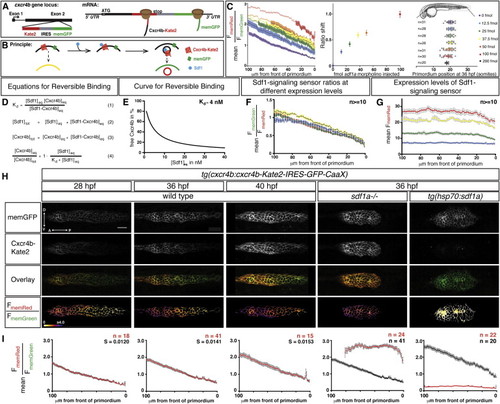
A Quantitative Signaling Reporter for Sdf1 (A and B) Schematic of Sdf1-signaling sensor construct (A) and concept (B). (C) (Left) Mean FmemRed/FmemGreen ratio along the anterior-posterior axis of n e 20 primordia from tg(cxcr4b:cxcr4b-Kate2-IRES-GFP-CaaX) embryos injected with sdf1a morpholino. Circles are mean ratios, and error bars represent SEM. Open circles indicate ratios greater than the SD corrected mean FmemRed/FmemGreen ratio in sdf1a/ primordia. (Middle) Shift of the FmemRed/FmemGreen ratio curves on left. The error bars represent SD. (Right) Primordium position in embryos injected with increasing amounts of sdf1a morpholino. The vertical bars represent the average position of the primordium, the error bars represent SD, and the circles represent the positions of individual primordia. 35 hpf embryo schematic adapted from Kimmel et al., (1995). (D) Derivation of equation for reversible binding of Sdf1 to Cxcr4b (Equation 4) using the definition of the dissociation constant (Equation 1) for the reversible reaction Cxcr4beq+Sdf1eq Ì Cxcr4b-Sdf1eq (wherein Cxcr4beq is free receptor, Sdf1eq is free ligand, and Cxcr4b-Sdf1eq is receptor-ligand complex) and mass balance for Sdf1 (Equation 2) and Cxcr4b (Equation 3). (E) Graph of Equation 4 for a Kd of 4 nM (Crump et al., 1997). (F) Mean FmemGreen/FmemRed ratio values across 100 μm beginning at the front of the primordium in 36 hpf wild-type embryos with increasing levels of expression of the signaling sensor indicated in (G). (G) Mean FmemRed intensity values across 100 µm beginning at the front of the primordium in 36 hpf embryos carrying different combinations and copy numbers of the signaling sensor transgenes (blue, Sdf1 sensorGRp1/+, n = 14; green, Sdf1 sensorGRp7/+, n = 17; yellow, Sdf1 sensorGRp1/ Sdf1 sensorGRp7, n = 10; red, Sdf1 sensorGRp7/ Sdf1 sensorGRp7, n = 16). The colored and gray bars indicate SEM in (F) and (G), respectively. (H) Single confocal slices through the primordium in live embryos of the indicated genotypes and stages, all carrying the Sdf1-signaling sensor. The FmemRed/FmemGreen images are inverted heat maps of the ratio. (I) Mean FmemRed/FmemGreen along the anterior-posterior axis of n e 10 primordia with 0 µm representing the front of each primordium. Red circles indicate the mean FmemRed/FmemGreen in embryos of the indicated genotype; black circles, where present, indicate the mean FmemRed/FmemGreen of wild-type embryos or heat-shocked control embryos. Gray bars indicate SEM. Anterior is to the left in (H). Scale bar, 20 μm. |
| Genes: | |
|---|---|
| Fish: | |
| Condition: | |
| Anatomical Terms: | |
| Stage Range: | Prim-5 to Prim-25 |
Reprinted from Cell, 155(3), Venkiteswaran, G., Lewellis, S.W., Wang, J., Reynolds, E., Nicholson, C., and Knaut, H., Generation and Dynamics of an Endogenous, Self-Generated Signaling Gradient across a Migrating Tissue, 674-687, Copyright (2013) with permission from Elsevier. Full text @ Cell