
Fig. 1
- ID
- ZDB-FIG-130910-20
- Publication
- Kim et al., 2013 - Multi-organ Abnormalities and mTORC1 Activation in Zebrafish Model of Multiple Acyl-CoA Dehydrogenase Deficiency
- Other Figures
- All Figure Page
- Back to All Figure Page
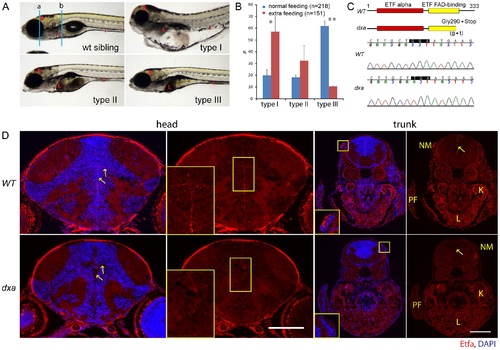
Classification of dxavu463 homozygous mutants, positional cloning of dxavu463 and Etfa protein expression. (A) Representative phenotypes of most severe (type I), moderate (type II) and mild (type III) dxa homozygous mutants at 7 dpf. Blue lines (a and b) indicate region of transverse sections in D. (B) Spectrum changes of type I, II and III mutants under different feeding conditions. Blue bars indicate the proportion of mutants under regular feeding (n = 218, 5 clutches), red bars for the proportion of mutants under extra feeding condition (n = 151, 3 clutches), p* = 0.03, p** = 0.00015. (C) Primary predicted structure of Etfa protein in wild-type and dxa zebrafish. Shaded codon indicates the null mutation of etfa in dxa zebrafish (GGA (Glycine) to TGA (stop)). (D) Anti-Etfa immunostaining (red) in wild-type control (upper panel, n = 9/9) and homozygous mutant (lower panel, n = 9/9) at 9 dpf. DAPI (blue) was used for nucleus staining. Arrows indicate Etfa expression in the ventricular region of the brain. Magnified midline views of yellow rectangles are in the left corners. Magnified rectangles on the trunk sections indicate neuromast hair cells. NM, neuromast; PF, pectoral fin; K, kidney; L, liver. Scale bar = 100 μm. |
| Gene: | |
|---|---|
| Antibody: | |
| Fish: | |
| Anatomical Terms: | |
| Stage: | Days 7-13 |
| Fish: | |
|---|---|
| Observed In: | |
| Stage Range: | Day 5 to Days 7-13 |