
FIGURE
Fig. 5
Fig. 5
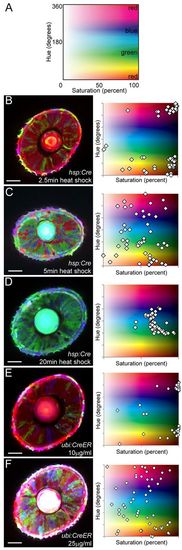
Optimization of color diversity. (A) Hue-Saturation plot, with colors displayed according to their color profile. Pure colors (red, green, blue) are highlighted. 0° hue is equivalent to 360° hue. (B-F) Confocal images of the eye of a ubi:Zebrabow-M transgenic larva under different Cre activity levels. Cre was induced by heat shock (B-D) or by addition of tamoxifen (E,F). Heat-shock duration and tamoxifen concentration are as indicated. Each data point represents the color profile of a single cell within one optical section. Scale bars: 50 μm. |
Expression Data
Expression Detail
Antibody Labeling
Phenotype Data
Phenotype Detail
Acknowledgments
This image is the copyrighted work of the attributed author or publisher, and
ZFIN has permission only to display this image to its users.
Additional permissions should be obtained from the applicable author or publisher of the image.
Full text @ Development