
Fig. 1
- ID
- ZDB-FIG-130618-57
- Publication
- Lee et al., 2013 - Dermal fin rays and scales derive from mesoderm, not neural crest
- Other Figures
- All Figure Page
- Back to All Figure Page
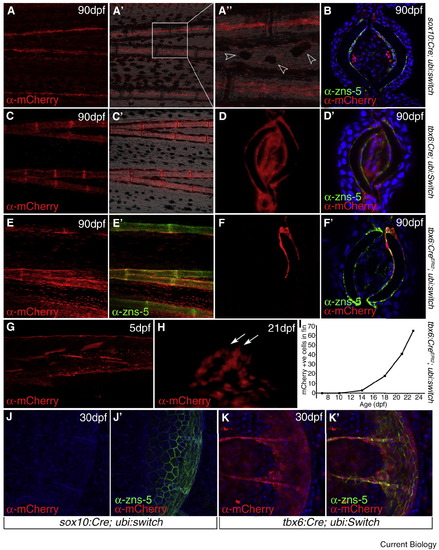
Fin osteoblasts derive from late immigrating paraxial mesoderm. (A, B) Adult (90 dpf) sox10:Cre; ubi:switch transgenics showing derivatives in the fin derived from neural crest and sox10 expressing cells. Lateral view of wholemount fin, immunostained to detect mCherry, indicates labelled cells running along the fin rays (A). Superimposing on a brightfield image demonstrates that these run within the lepidotrichia (A′). Magnified view of part of A′ highlights the position within the ray and also mCherry-positive melanophores (arrowheads; A′′). Transverse cryosection of a sox10:Cre; ubi:switch fin immunostained for mCherry (red) and zns-5 (green) and counterstained with DAPI (blue). mCherry positive cells are concentrated in two bundles within the fin ray and are zns-5 negative (B). (C–F′) Adult (90 dpf) fins of tbx6:Cre; ubi:switch (C–D′) and tbx6:CreERt2; ubi:switch (E–F′) imaged as lateral wholemounts (C–C&prime& E–E′) or as transverse cryosections (D–D&prime& F–F′). Fins have been immunostained for mCherry (red; C–F′) and zns-5 (green; D′,E′,F′) and counterstained with DAPI (blue; D′,F′). (C) is also shown superimposed on the Nomarski image (C′). In both lines, osteoblasts are mCherry positive. (G–H) Lateral images of the trunk/tail (G) and dorsal medial fin (H) of 5 dpf (G) and 21 dpf (H) tbx6:CreERt2; ubi:switch transgenics treated with 4-hydroxytamoxifen and immunostained for mCherry. Larvae with no labelled cells in the fins at larval stages (G) often were observed to have chains of cells, aligned to forming bony rays, within the fins at 21 dpf (arrows; H). (I) Counts of mCherry-positive cells in the fins during postembryonic development. Secondary immigration was noted from 14 dpf. (J–K′) Lateral images of scales in 30 dpf sox10:Cre; ubi:switch (J–J′) and tbx6:Cre; ubi:switch (K–K′) transgenics immunostained for mCherry (red; J–K′) and zns-5 (green; J′,K′). Co-labelling is only seen in the tbx6:Cre; ubi:switch line. |