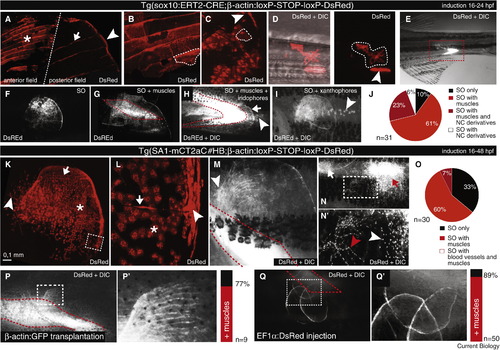
Mesoderm-derived scale osteoblasts. (A–J) sox10:ERT2-Cre-mediated cell labeling. (A) Labeled SOs along the serrations (asterisk), the radii (arrow) and at the margin (arrowhead). (B) Labeled SOs covering the scale outer surface in the anterior field and (C) in the posterior field. Representative cell shapes are highlighted by dashed insets. The arrowhead in (C) highlights SOs at the posterior scale margin. (D) Labeled neural crest-derived cell types (dashed inset) and mesodermal derivatives (muscle fiber, arrowhead) in the trunk of 5 days post-fertilisation larvae. (E) Somitic muscle clone in adult fish. (F) SO clone. (G) SOs and somatic muscles (dashed inset). (H) SOs, somatic muscles (red dashed inset), and iridophores (arrowhead). (I) SOs and xanthophores (arrowhead). (J) Analysis of clonal association between labeled scales (n = 31) and neural crest-/mesoderm-derived tissues. (K–O) SA1-mCT2aC#HB-mediated cell labeling. (K) Scale clone with labeled fibroblast-like cells (arrowhead) and scale osteoblasts (SOs) along the serrations (arrow) and on the outer surface of the posterior field (asterisk). (L) Magnification of the inset in (K) showing labeled SOs along the radii (arrow), covering the scale surface (asterisk), and at the scale margin (arrowhead). (M) Recombined SOs associated with recombined muscles. (N,N′) Recombined SOs associated with recombined blood vessels. (N) Labeled SOs along the serrations (white arrow) and on the scale surface (red arrow). (N′) Magnification of the inset in (N) showing recombined blood vessels (red arrowhead) and fibroblast-like cells (white arrowhead). (O) Analysis of clonal association between labeled scales (n = 30), muscles and blood vessels. (P,P′) Independent validation of SO/muscle clonal association by blastula transplantation (77%; n = 9) and (Q,Q′) transposon-based clonal insertion (89%; n = 50). (P′,Q′) are magnifications of the insets in (P) and (Q), respectively.
|
