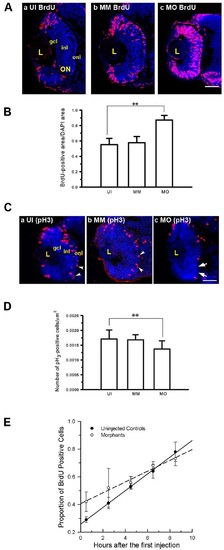
Mdka loss-of-function alters cell cycle kinetics. (A) BrdU labeled progenitors in uninjected (a) control (b) and Mdka loss-of-function embryos (c). (B) Histograms showing the average proportion of the retinal section occupied by BrdU-labeled cells. *P <0.001. n = 9 retinas/group. Scale bar equals 50μm.(C) Retinas of embryos at 48 hpf stained with antibodies against phosphohistone H3 (pH3) in uninjected (a), control (b), and Mdka loss-of-function embryos (c). (D) The number of pH3-stained cells/unit area. **P <0.01. n=12 embryos/group. MM, embryos injected with 5-pair mismatch control morpholinos; MO, embryos injected with mdka-targeted morpholinos (MO); UI, uninjected embryos. gcl, ganglion cell layer; inl, inner nuclear layer; L, lens; ON, optic nerve; onl, outer nuclear layer. Scale bar equals 50 μm. (E) Graph of the least-squares regression lines through data showing the proportion of BrdU-labeled progenitors as a function of time. An F-test was used to compare the control and experimental data. **P <0.05.
|
