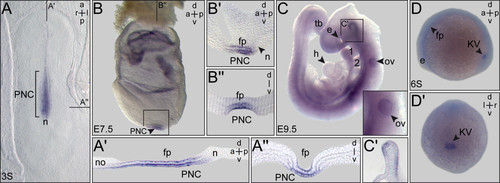
PACRG expression during early rabbit, mouse and zebrafish development. Whole-mount in situ hybridization of staged embryos. (A) Rabbit. Three somite (3S) stage blastodisc revealing PACRG expression in the posterior notochord (PNC) and floor plate. (A′) Sagittal section. (A′′) Transversal section (level marked in (A)). Note that the sagittal section revealed absence of PACRG from the node (A’). (B,C) Mouse. (B) E7.5 late headfold mouse embryo displaying PACRG expression in the PNC and floor plate. (B′) Sagittal section. (B′′) Transversal histological section. (C) E9.5 embryo. Otic vesicle shown in higher magnification in inset. Box indicates brain region of which a histological section is provided in (C′). (C′) Histological sagittal section, revealing staining in ventral midline of the brain. (D) 6-Somite stage zebrafish embryo. PACRG expression in the Kupffer’s vesicle (KV) and floor plate. a = anterior; d = dorsal; e = eye; fp = floor plate; h = heart; l = left; n = node; no = notochord; ov = otic vesicle; p = posterior; r = right; s = somite; tb = tail bud; v = ventral.
|
