
Fig. S5
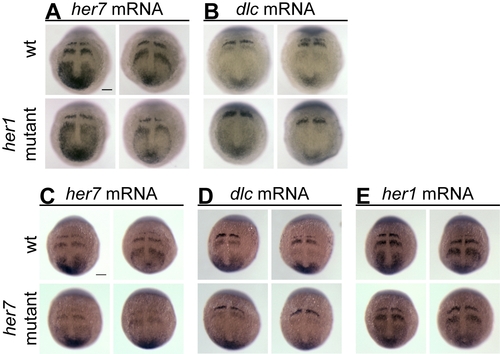
Tissue-level transcriptional oscillations in her1 and her7 mutant embryos at the bud stage. (A, B) Wildtype (wt, upper row) and her1 mutant (lower row) embryos at the bud stage in situ stained for her7 (A) or dlc (B) mRNA expression. (C–E) wt (upper row) and her7 mutant (lower row) embryos at the bud stage in situ stained for her7 (C), dlc (D), or her1 (E) mRNA expression. Two representative examples per condition shown. Alternating patterns indicative of tissue-level oscillatory gene expression are evident for each genotype and probe. Whole mount preparations, anterior to the top, scale bars, 100 μm.
|